StatCalc: Statistical Calculators
‹View Table of Contents
Tables (2 x 2, 2 x n)
Both single and stratified 2 x 2 tables can be analyzed to produce odds ratios and risk ratios with confidence limits, several types of chi square tests, Fisher exact tests, Mantel-Haenszel summary odds ratios, chi square, and associated p-values.
To open a 2 x 2 table, select StatCalc > Tables (2 x 2, 2 x n) from the Epi Info™ main menu. The table has Exposure on the left and Outcome across the top. Not all textbooks and articles use the same conventions. Carefully observe the labels and transpose data items if necessary. Below the table, the statistics populate as Exposure and Outcome data are entered and summary results populate in stratified analyses to the right of the table. Each stratum in a dataset must be entered individually in corresponding tabs located at the top of page. StatCalc is capable of performing calculations on up to nine different strata.
Guidelines
- The values in the cells must be counts representing the number of records meeting the specifications in the Exposure and Outcome rows and columns.
- A case-control study is one in which the ill and well individuals are selected and the number of exposed and unexposed is subsequently ascertained. In a cohort study, the exposed and unexposed are selected and the number of ill in each group is subsequently ascertained. A cross-sectional study starts with neither illness nor exposure determined, and ascertains both during the study.
- In cohort studies, the risk ratio may be calculated from the results. In case-control studies, the odds ratio may be used as an approximation of the risk ratio if the disease is rare in the general population from which cases and controls are selected.
- For valid results, outcomes in each record must be independent of those in other records. The values for one individual cannot be used to predict those for another. Confounding must be removed by stratifying the confounding variables.
Single 2 x 2 tables frequently are used in epidemiology to explore associations between exposures to risk factors and disease or other outcomes.
Given a yes-no or other two-choice response describing disease and another describing exposure to a risk factor, StatCalc produces several kinds of statistics that test for relationships between exposure and disease.
Generally, an association is suggested by an odds ratio or risk ratio with a confidence interval larger or smaller than 1.0.
Note: Confidence intervals are designated by the Lower and Upper columns in the statistical tables.
The further the odds ratio or risk ratio is from 1.0, the stronger the apparent association. Statistical significance can be assessed by p-values for the chi square and Fisher exact tests that are small, <.05; or confidence limits for the odds ratio that do not include 1.0.
The expected value of a cell is the product of the marginal totals for that cell divided by the grand total for the table. If any expected value is less than five, it is recommended you use the Fisher exact test results and the exact confidence limits. If the numbers in the table are all large, the other tests should indicate nearly the same result.
Tables Example
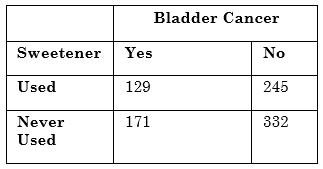
The following example investigates a hypothetical study exploring the relationship of artificial sweetener use with bladder cancer.

- From the StatCalc application main page, select Tables (2 x 2, 2 x n). A blank table opens in the StatCalc application window.
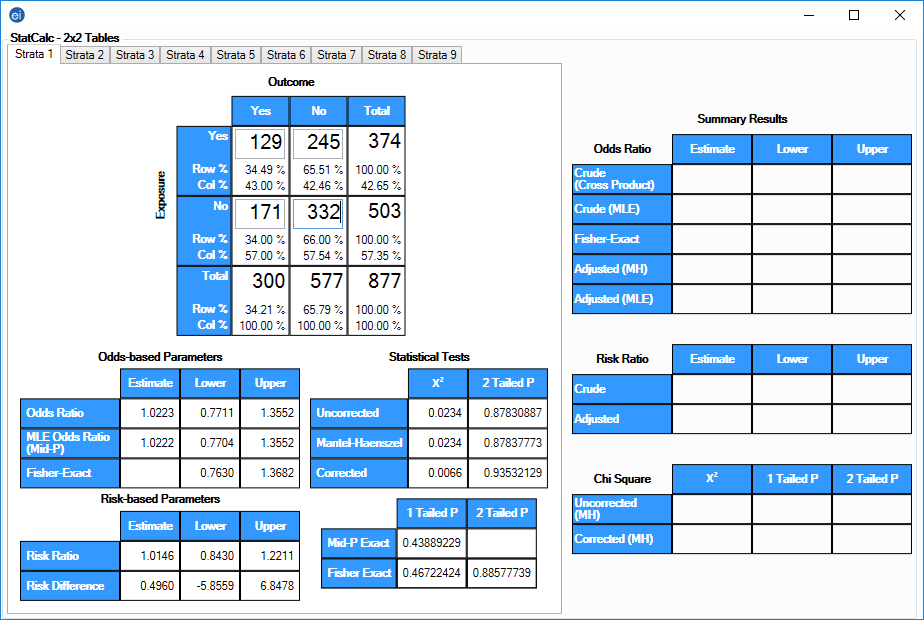
- Enter the data from the above sample table.
- Results are generated as the different values in the cells are populated.

The odds ratio of 1.02 and the confidence limits that include 1.0 fail to provide evidence of any association between sweetener use and bladder cancer (Schlesselman JJ. Case-control studies. New York: Oxford University Press, 1982).