Additional versions
Social Media Graphics
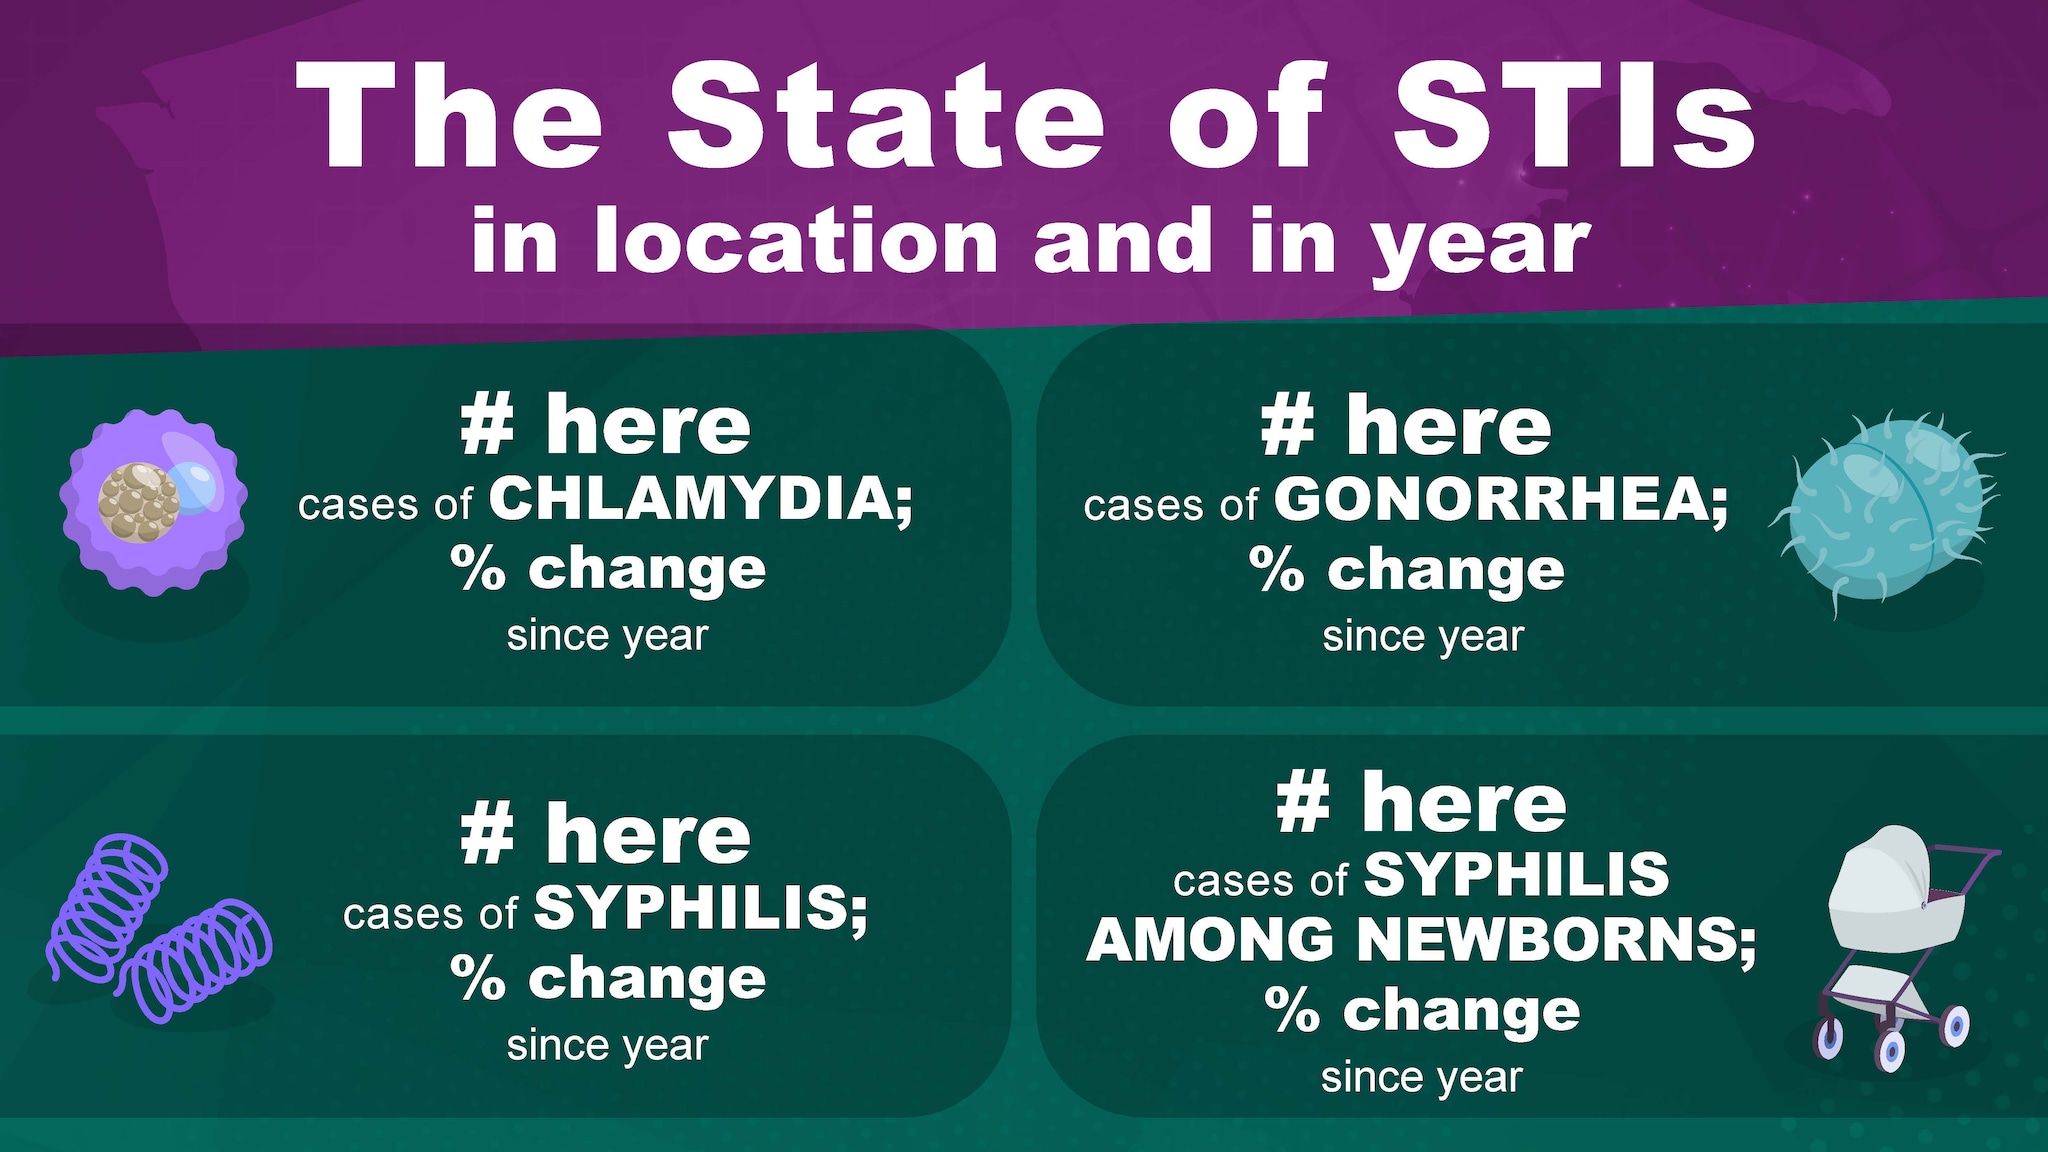
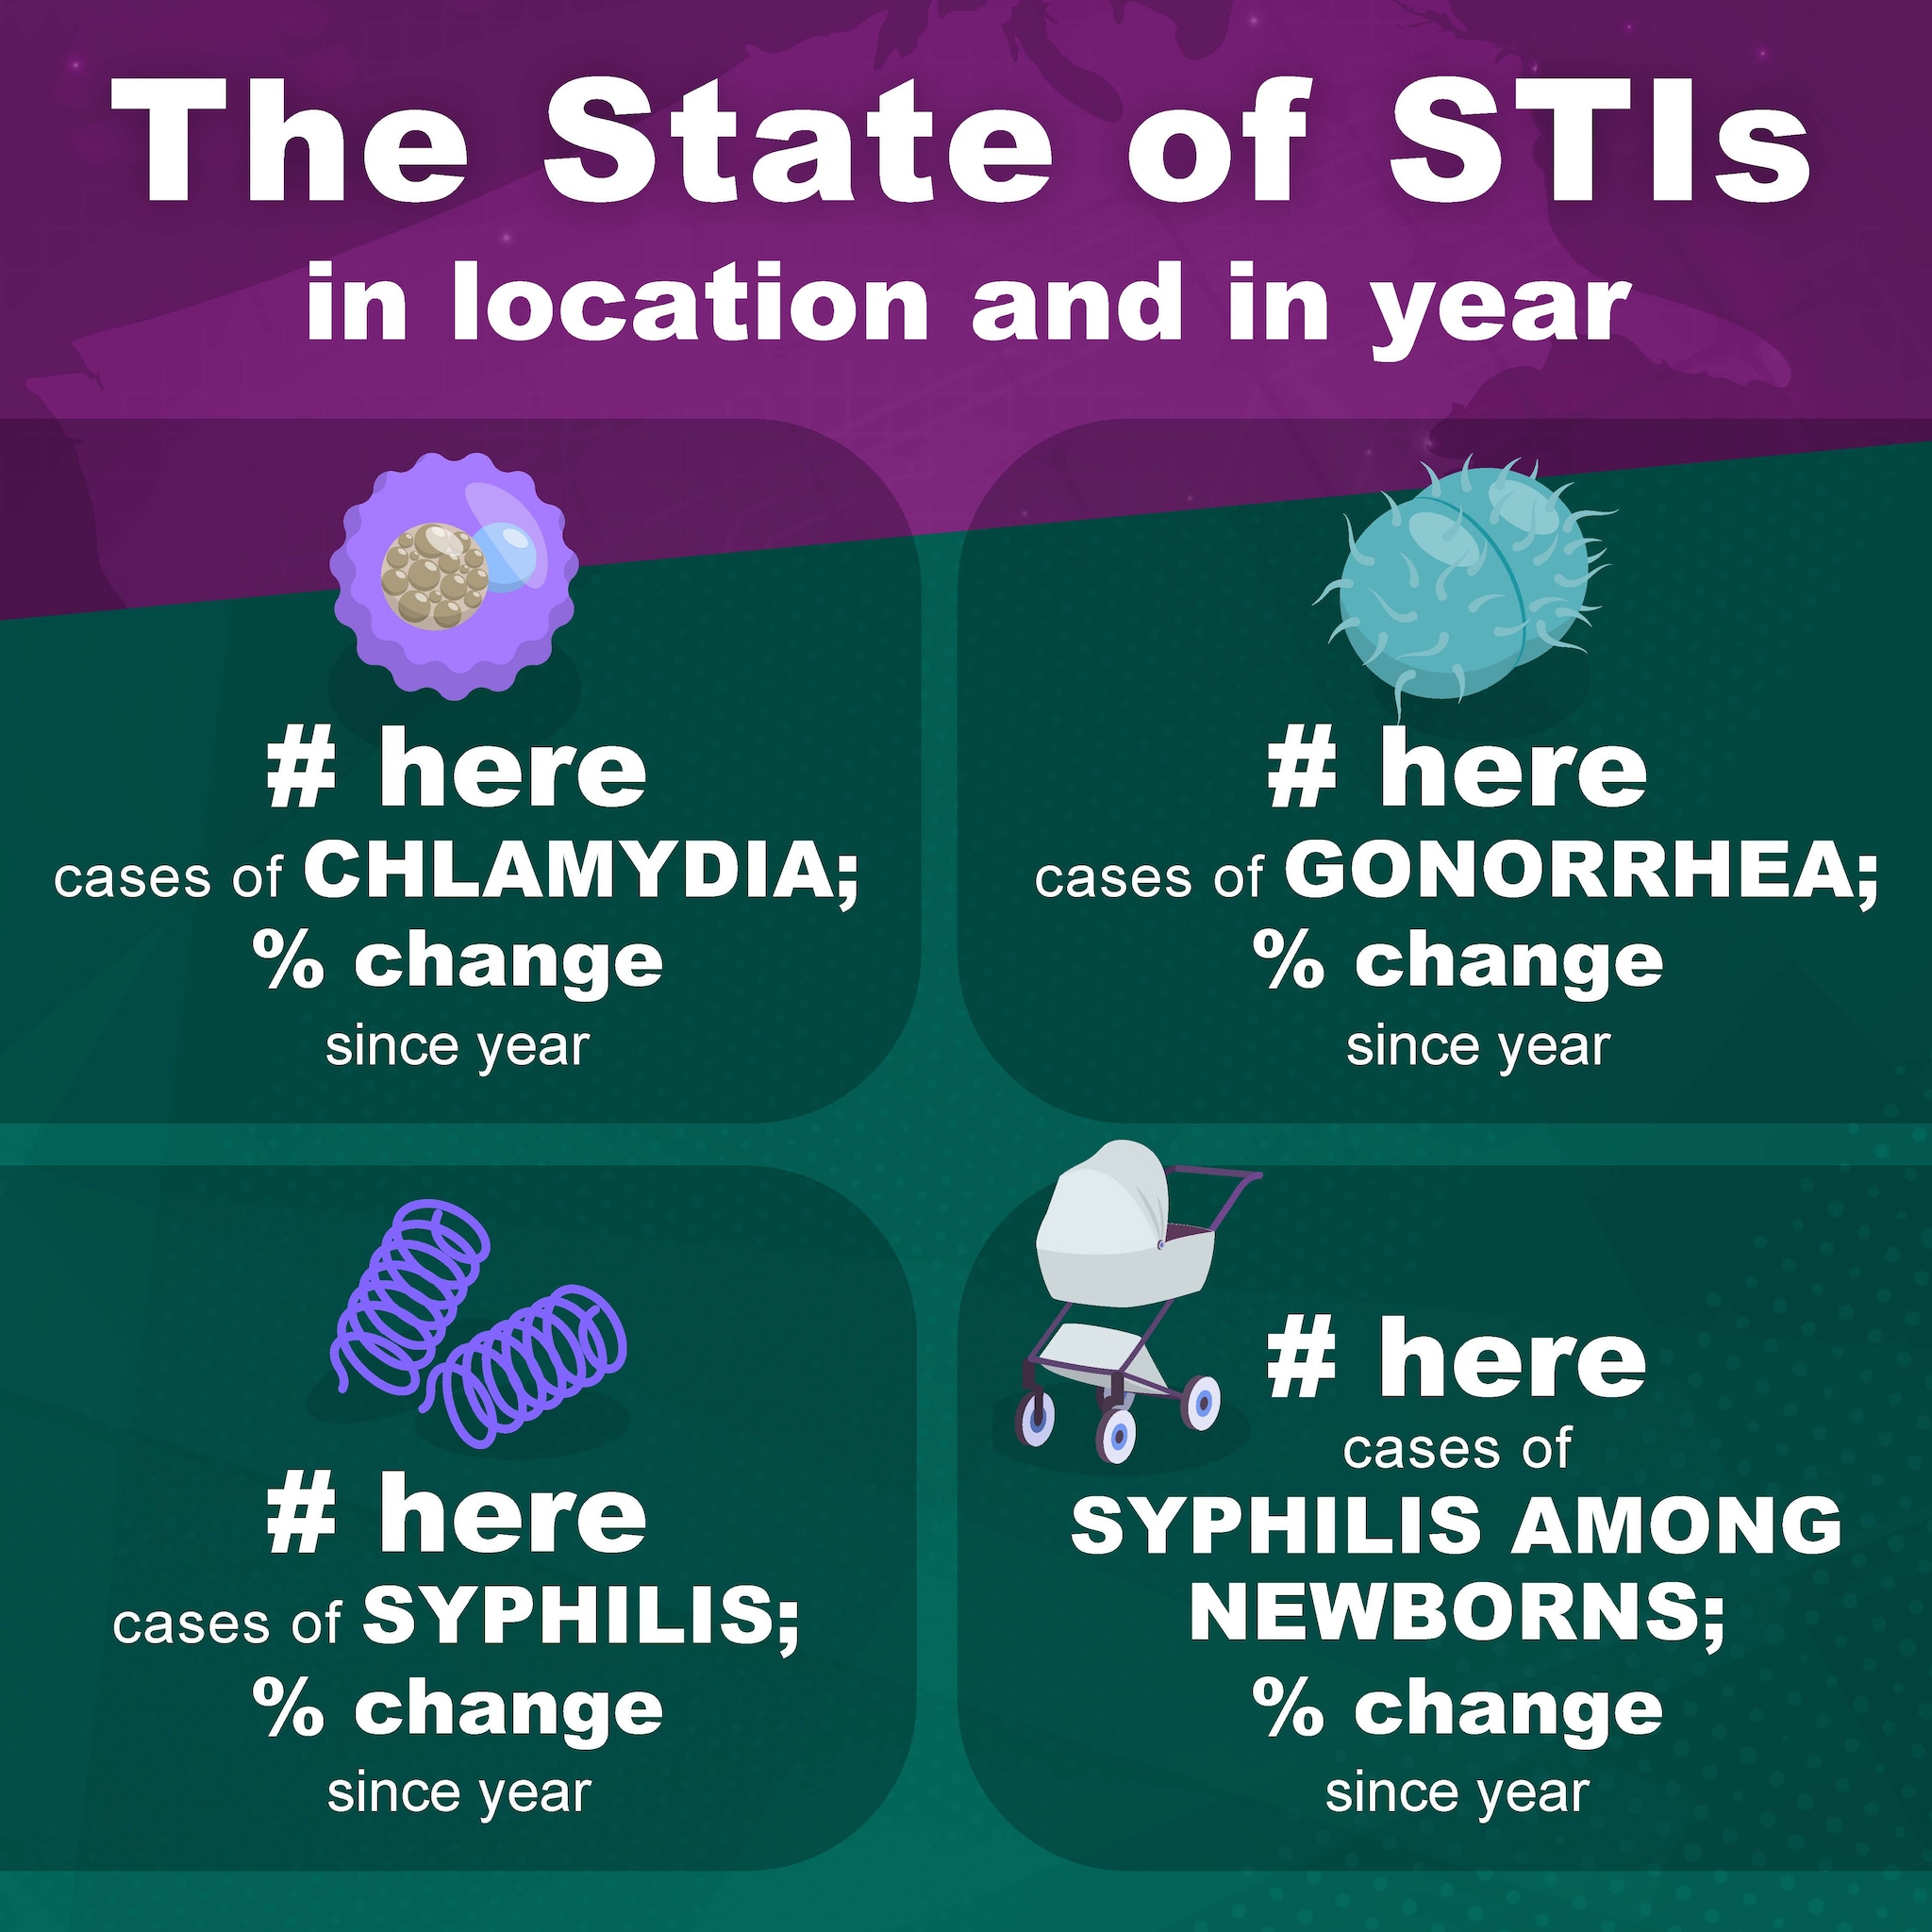
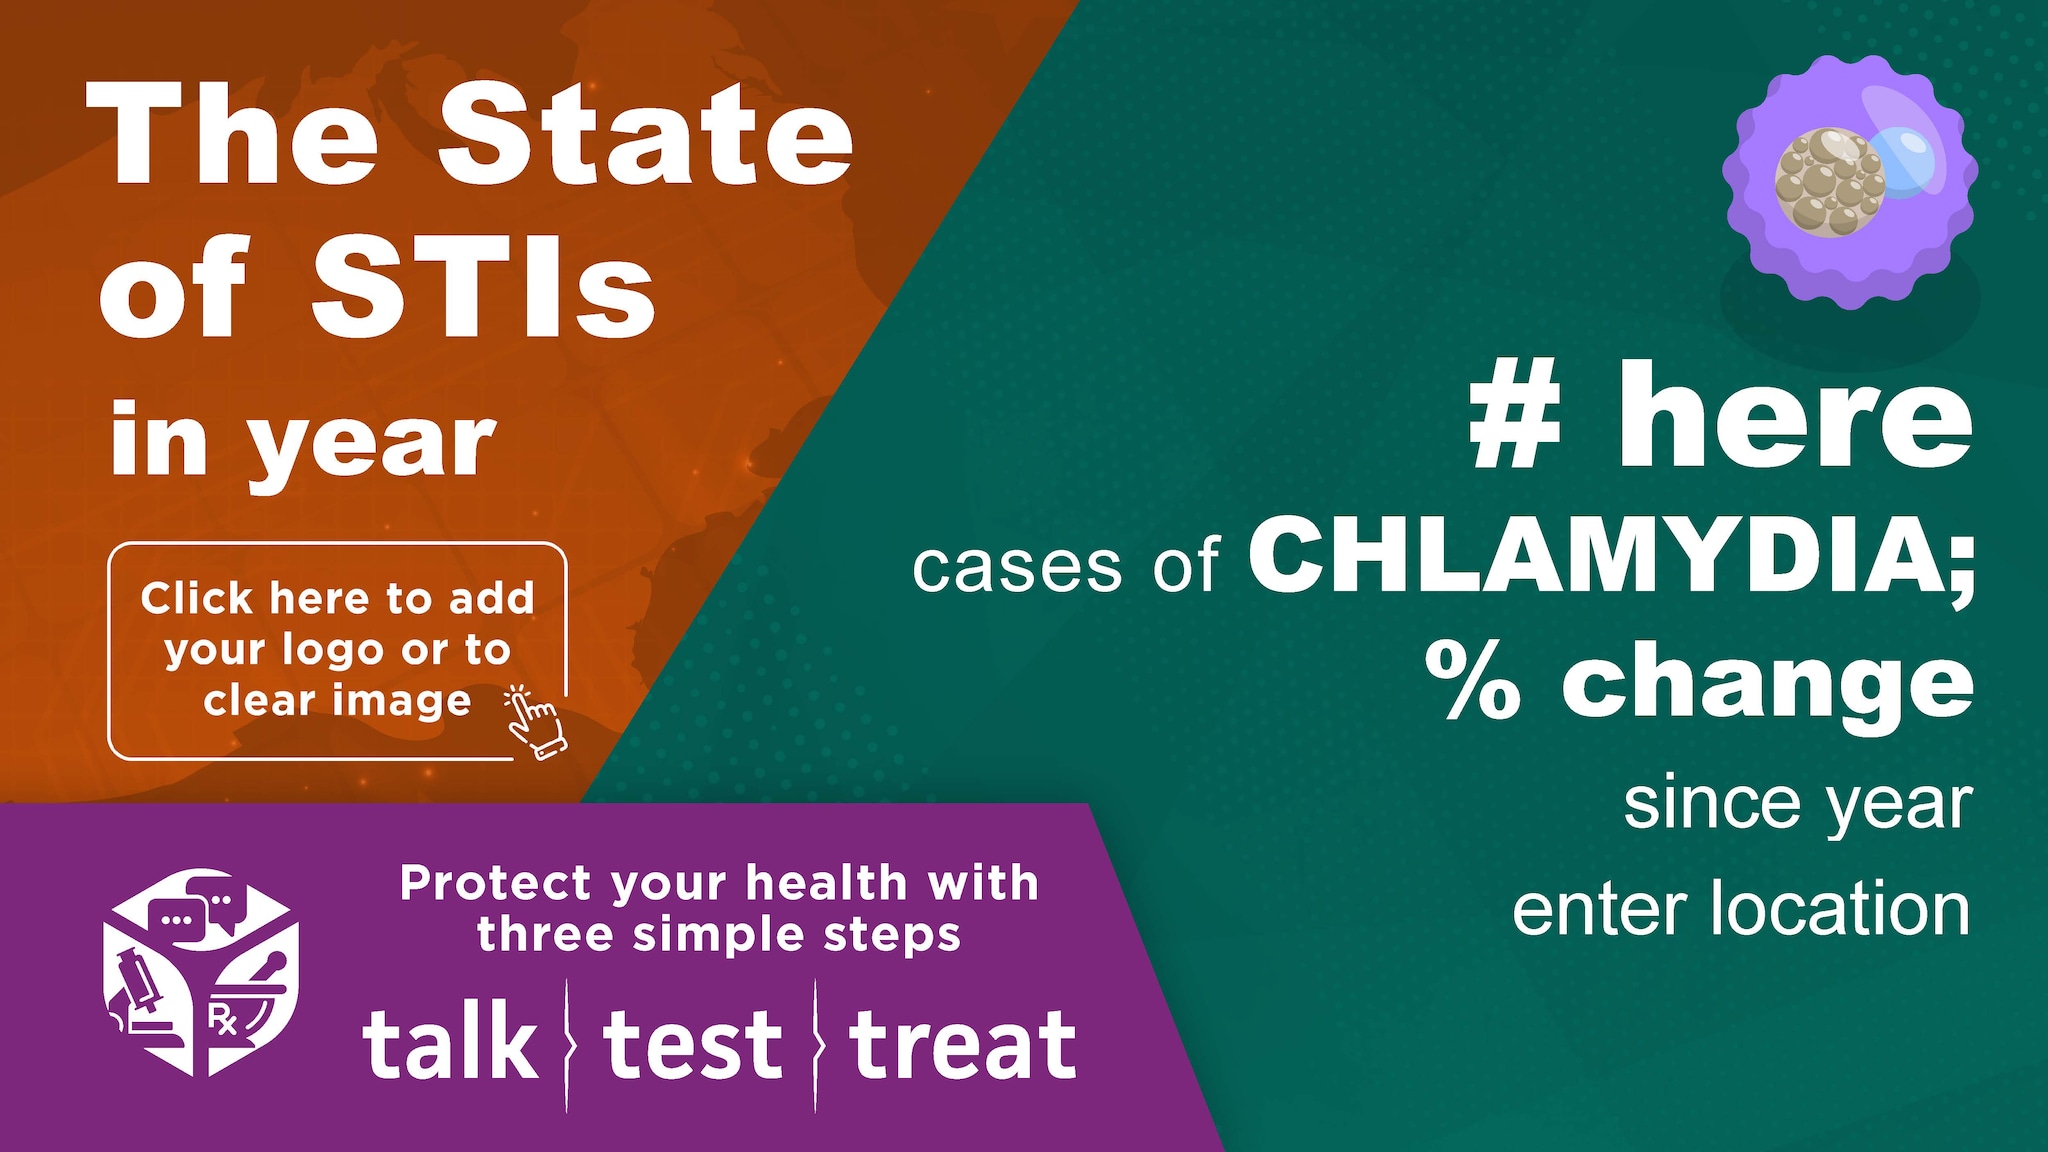
The following graphics have been optimized for X (formerly known as Twitter), Facebook, and Instagram.
All Reportable Infections
Chlamydia
Gonorrhea
Syphilis
Congenital Syphilis
Instructions
Open the PDF from your desktop, not your browser. If using social media graphics, check to make sure the selected document is labeled for the platform you plan to use. Keep these instructions visible in another window if possible.
You can use data from the STI Surveillance Report State Ranking Tables to customize your graphics.
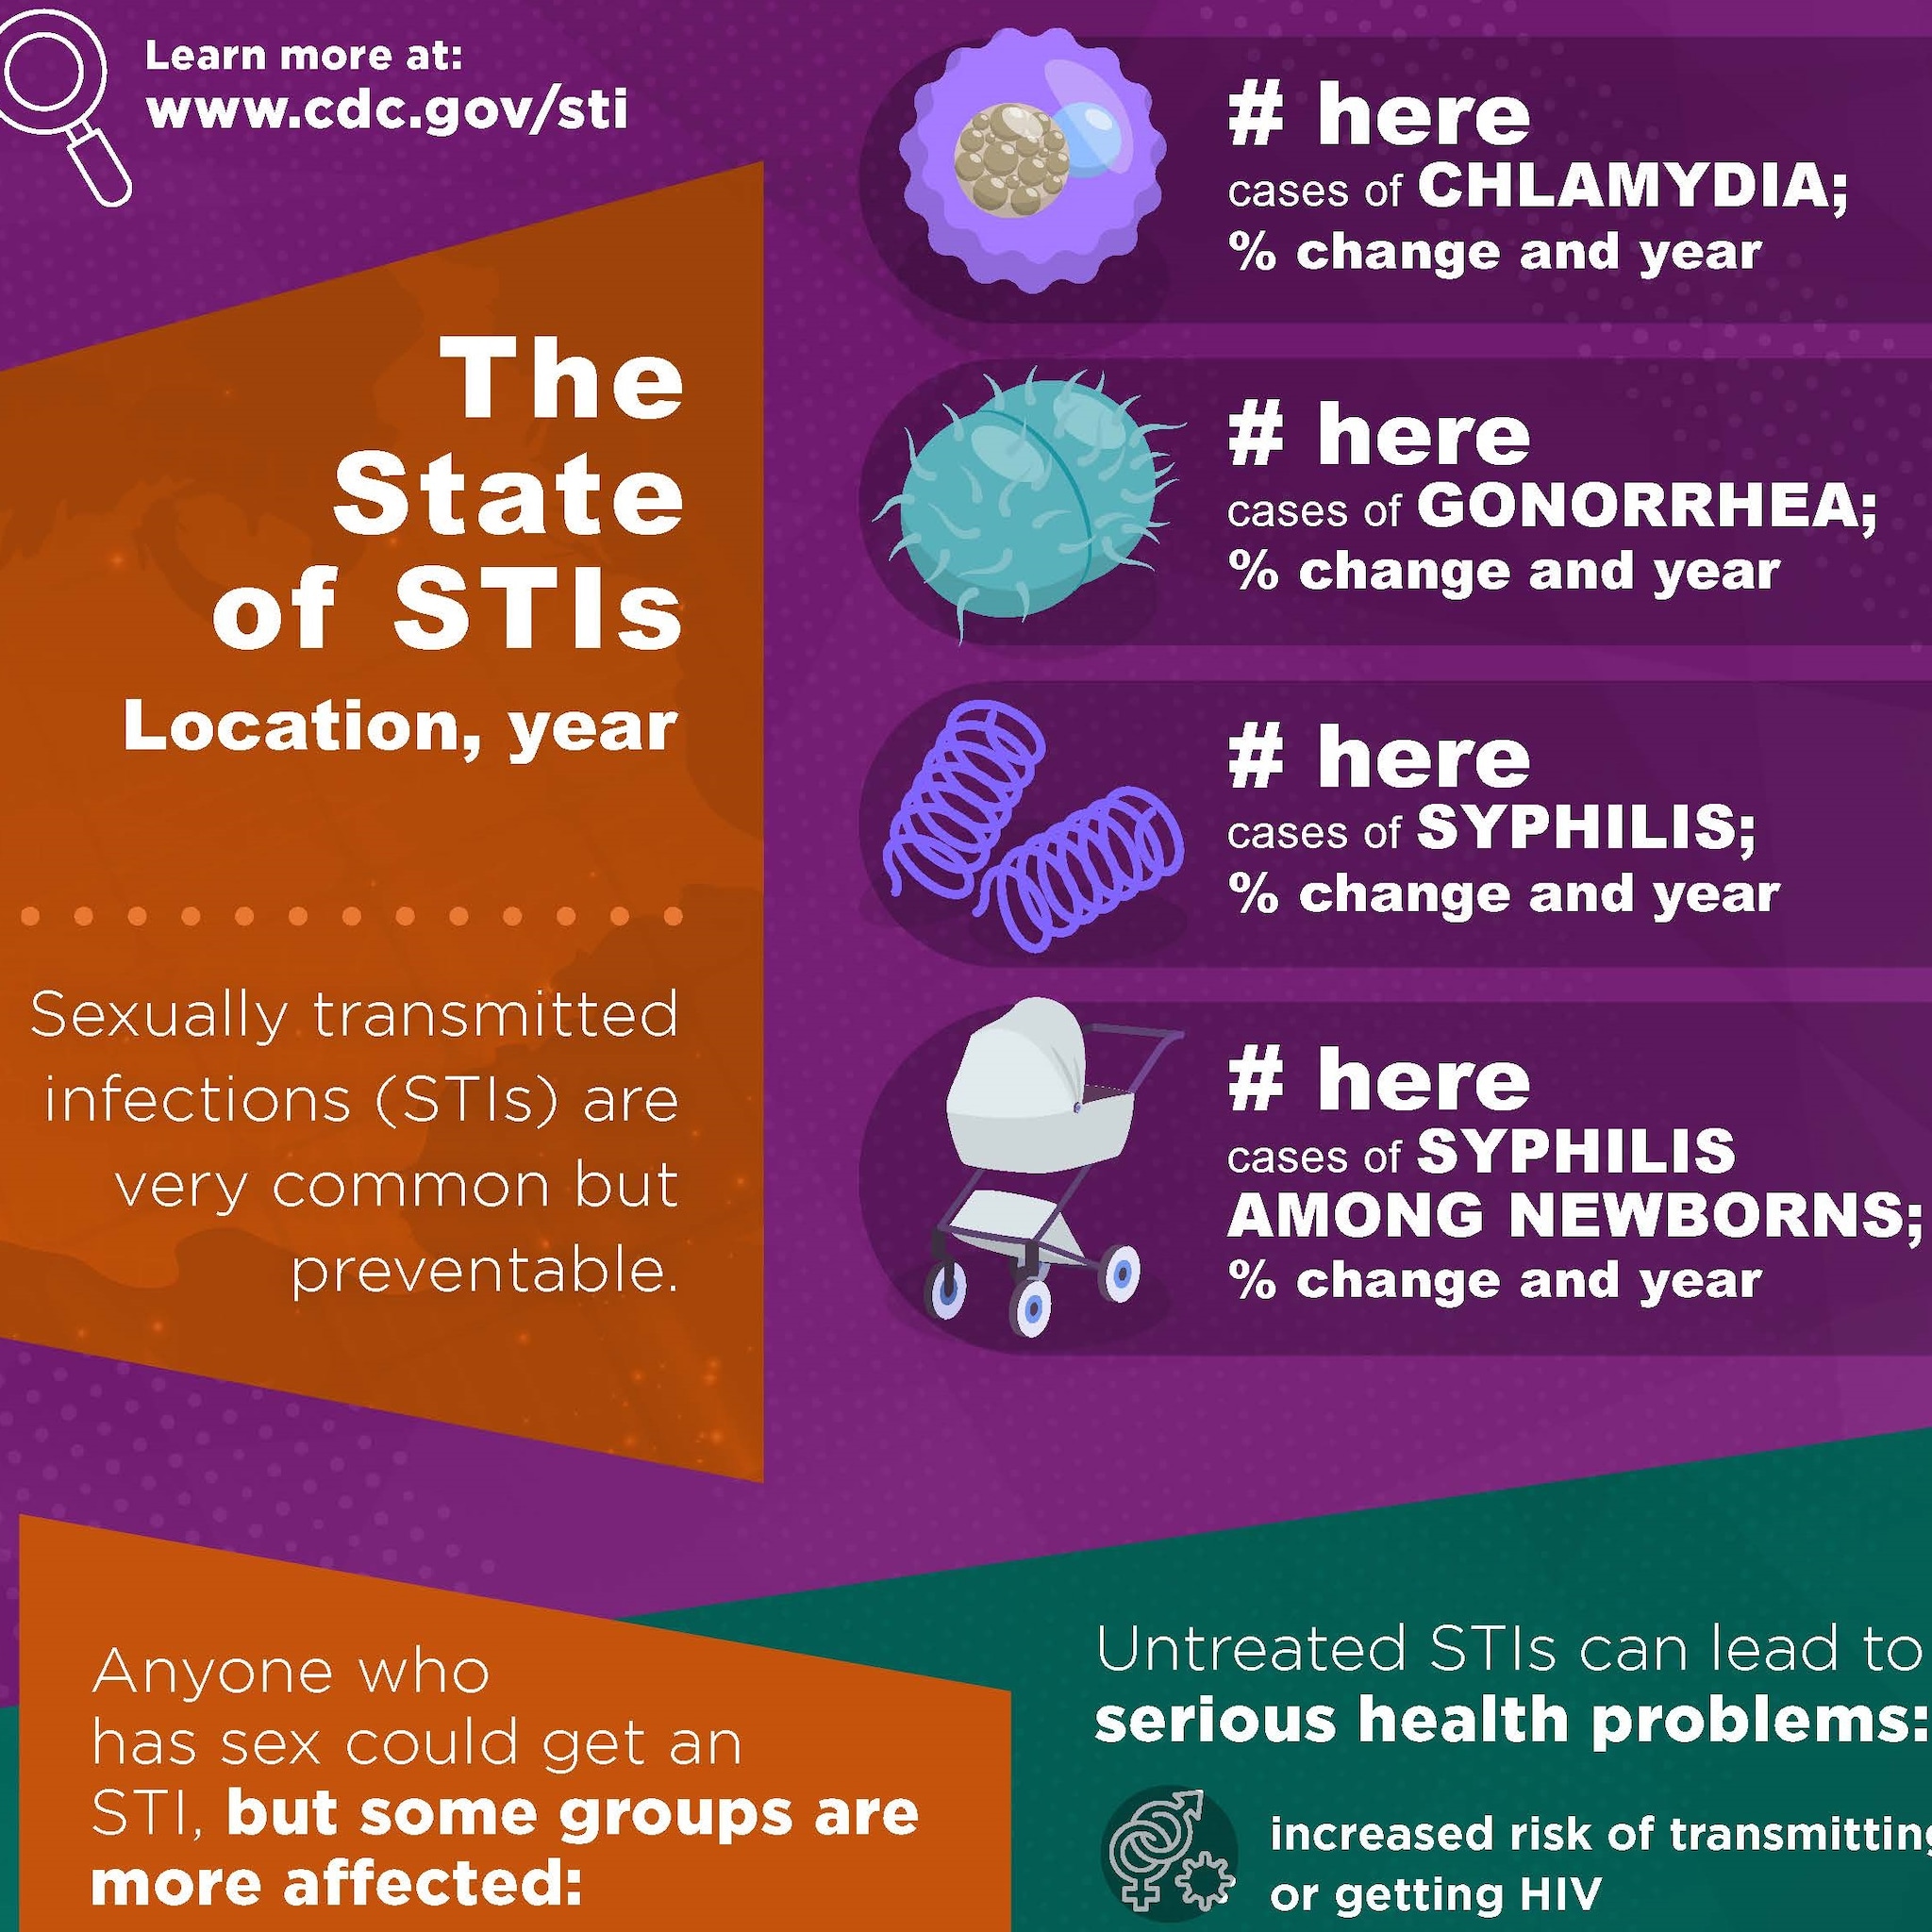
Customizable infographic instructions
If editing the infographic, there will be 10 editable text fields in lighter colored boxes in the PDF. They include prompts for the types of information to include. Click inside the boxes to edit. For additional help, see the national version of The State of STIs (the linked version is designed differently but contains the same information).
Save your infographic with a new name, then print or share.
Customizable social graphics instructions
If editing the social media graphics, there will be 6 editable fields in lighter color boxes. The 5 text fields include prompts for the types of information to include (i.e., year; number of cases; whether cases are increasing or decreasing and by how much; since what year; and location). An optional image field is also available to add your logo or clear image. Click inside the boxes to edit.
Save your graphic with a new name and as an image file, such as a JPG or PNG. If needed, sites are available to convert a PDF into a JPG file. Share the image file to your social media platform of choice.

