Key points

Best Practices
When used inside a dashboard, data bites provide calculated summary information that react to dashboard level filtering as an interactive page element.
As a reusable Data Visualization module, these data bites can be reused across a site and updated in a single editor.
Data Bites provide a way to aggregate data into a single value and provide manually created textual context about that value.
Use:
- When one number respresent a significant perspective.
- To create visual interest within a series of textual elements.
Don't Use:
- If isolating one point of data tells and incomplete perspective.
- If the supporting test needs to be more than three lines.
Quick Build Notes
- Select a data bite as the Visualization Type.
- Upload your data.
- Type in the title and other text fields in the General panel.
- Select your data column and function in the Data panel.
Configuration Options
The example visualizations below highlight options available for data bites. Key configuration selections are in the build notes section under each example.
For in-depth configuration information visit the Configuration Options section.
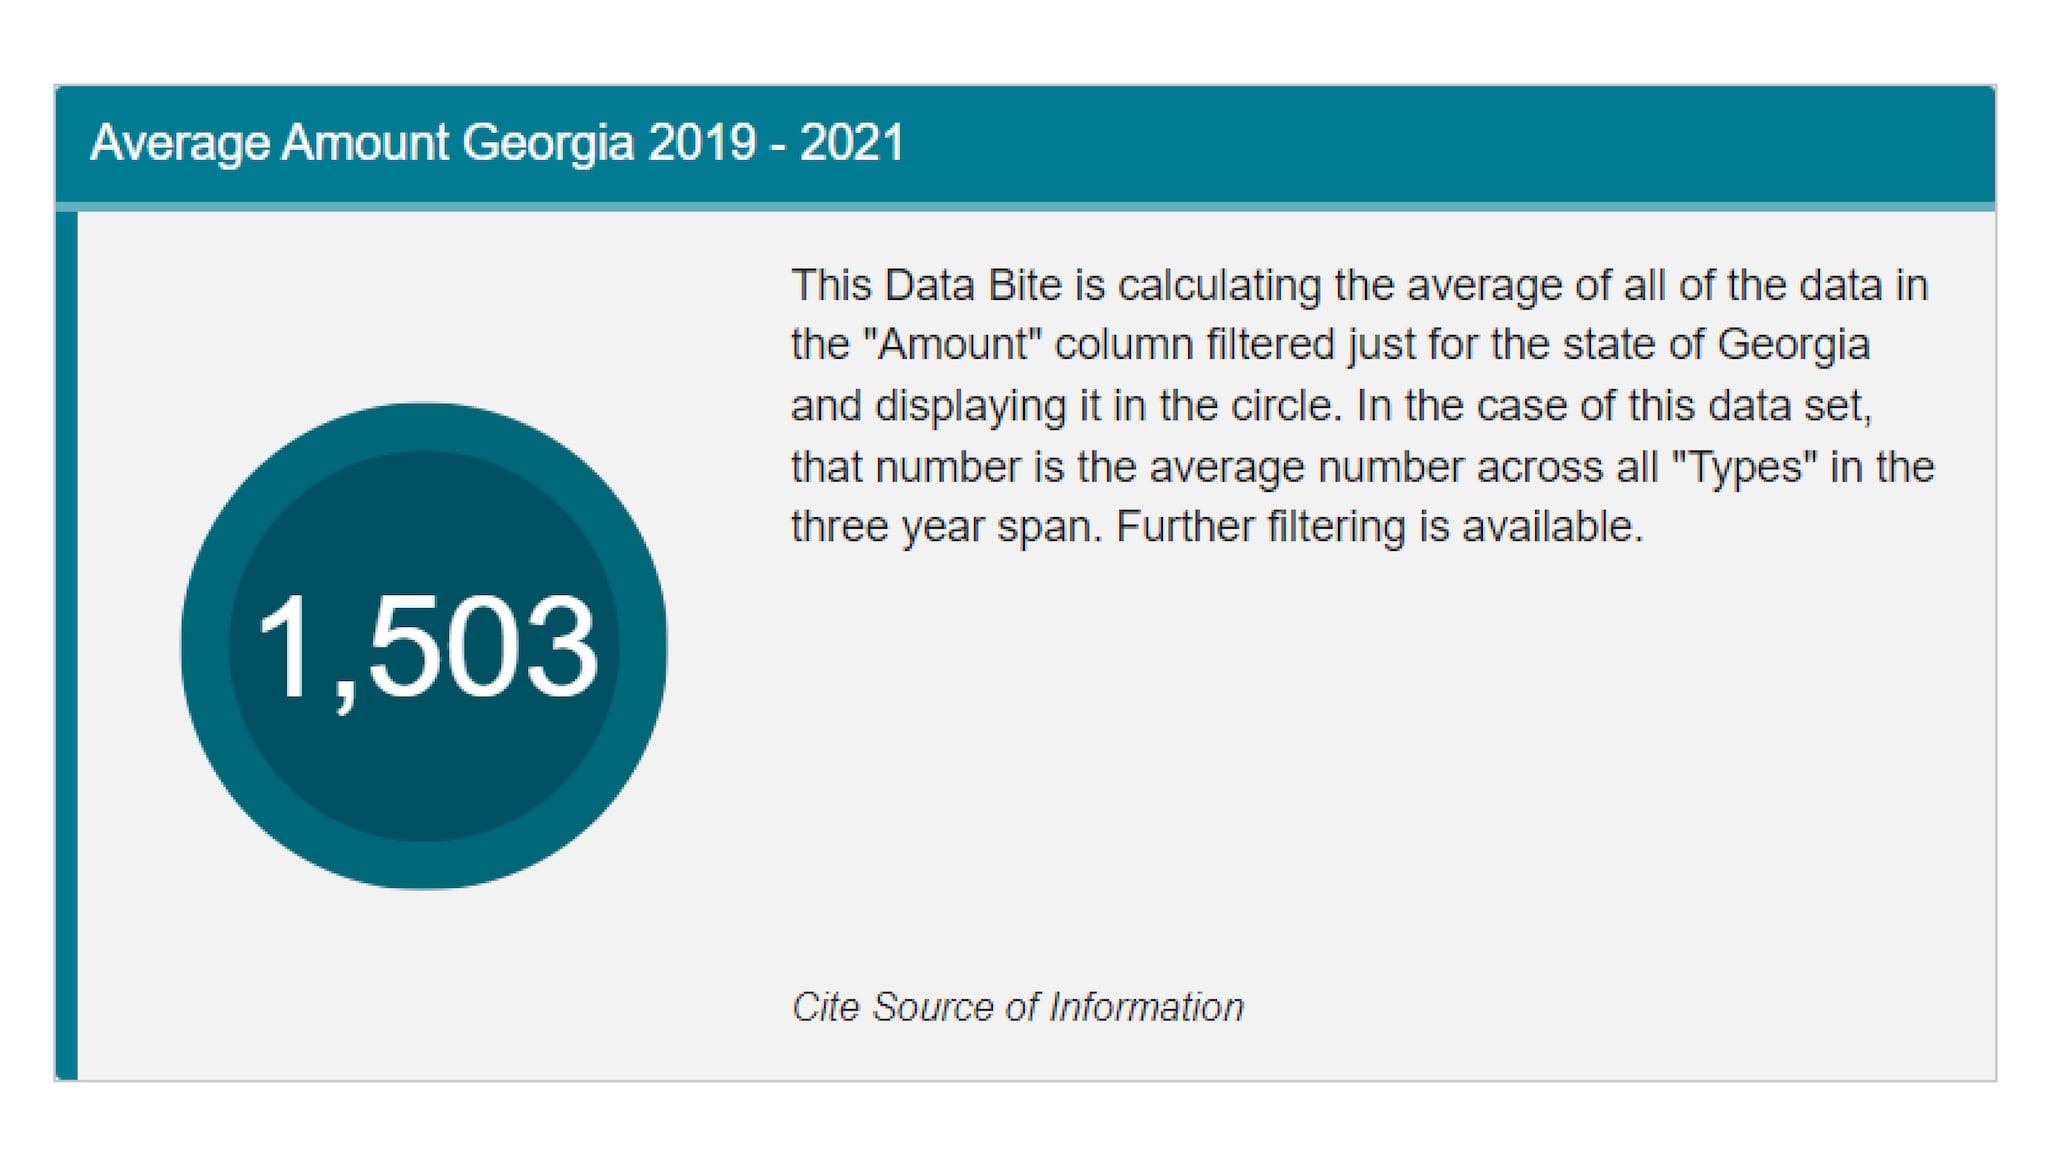
Calculated Average
This data bite shows the graphic on left calculating the average of the filtered data.
Data Sample: Data Bite Data
- Vertical
- Multiple Series: No
- Data Column: Amount
- Data Function: Mean (Average)
- Add Commas
- Column: Location
- Column Value: Georgia
- Image Display Type: None
- Image/Graphic Position: Left
Max Value
This data bite displays the maximum value of the filtered data inline with the description text. The image is provided using a linked URL.
Data Sample: Data Bite Data
- Vertical
- Multiple Series: No
- Data Column: Amount
- Data Function: Max
- Add Commas
- Image Display Type: Static
- Image/Graphic Position: Top
- Image URL: https://www.cdc.gov/wcms/4.0/cdc-wp/images-all-purpose/kitchen_adventurer_donut_1.jpg
- Alt Text: Donut
Sum of Data
This data bite is calculating the sum of all data in the selected column. The graphic was set to display above the description.
Data Sample: Data Bite Data
- Vertical
- Multiple Series: No
- Data Column: Amount
- Data Function: Sum
- Add Commas
- Image Display Type: None
- Image/Graphic Position: Top
Calculated Average with Picture
This data bite reflects the calculated average amount displayed above the description text. The image was added using a URL to set to display to the left.
Data Sample: Data Bite Data
- Vertical
- Multiple Series: No
- Data Column: Amount
- Data Function: Mean (Average)
- Add Commas
- Column: Location
- Column Value: Georgia
- Image Display Type: Static
- Image/Graphic Position: Left
- Image URL: https://www.cdc.gov/wcms/4.0/cdc-wp/images-all-purpose/kitchen_adventurer_donut_1.jpg
- Alt Text: Donut
Data Bites as an Interactive Element using a Dashboard
Data Bites can be added to a dashboard to allow a user to customize the data view.
Data Sample: Data Bite Data
Please note that these build notes are specific to the data bites only and do not give instructions to replicate this in a dashboard. For purposes of these notes, the visualizations are labeled 1, 2, 3, and 4 from top left to bottom right.
- Data Column: Amount (1, 2, 3, 4)
- Data Function: Mean (Average) (1), Sum (2), Count (3), Median (4)
- Add Commas
- Image Display Type: None (1, 2), Static (3, 4)
- Image/Graphic Position: Left (1, 2), Top (3, 4)
- Image URL: https://www.cdc.gov/wcms/4.0/cdc-wp/images-all-purpose/coastal-village.jpg (3), https://www.cdc.gov/wcms/4.0/cdc-wp/images-all-purpose/tavern.jpg (4)
- Alt Text: Coastal Village (3), Tavern (4)
Data Bite Using Conditional Imagery
Data bites can be configured to display different imagery depending on the value that is calculated. The image will change based on inputs and filtering.
Notice that once the number increases beyond 19 students with books, the image changes to numerous books. Conditional imagery helps if data sets are updated frequently or dashboard values change with filtering. Having a dynamic conditional image in data bites helps users translate the information. Conditional image URLs can be configured for sets of three or four values:
- Four values - Default, less than, equal to, and greater than.
- Three values - Default, less than or equal to, and greater than or equal to.
Conditional imagery can be set for data bites in a dashboard or as a stand alone visualization.
Data Sample: Conditional Image Bite Data
In order to display the dropdowns for the filters and have them be selectable, this data bite was set up in a dashboard. These build notes are only for the data bite and not instructions on setting up this dashboard.
- Data Column: Value
- Data Function: Sum
- Suffix: Students (with a leading space)
- Image Display Type: Dynamic
- Image/Graphic Position: Left
- Image URL (Default): /wcms/4.0/cdc-wp/images-all-purpose/young-friends.jpg
- Alt Text (Default): Youth Standing Together
- If Value <= 19 Then
- Show: /wcms/4.0/cdc-wp/images-all-purpose/blue-book.jpg
- Alt Text: Few books
- If Value >= 20 Then
- Show: /wcms/4.0/cdc-wp/images-all-purpose/books-stacked.jpg
- Alt Text: Many Books
