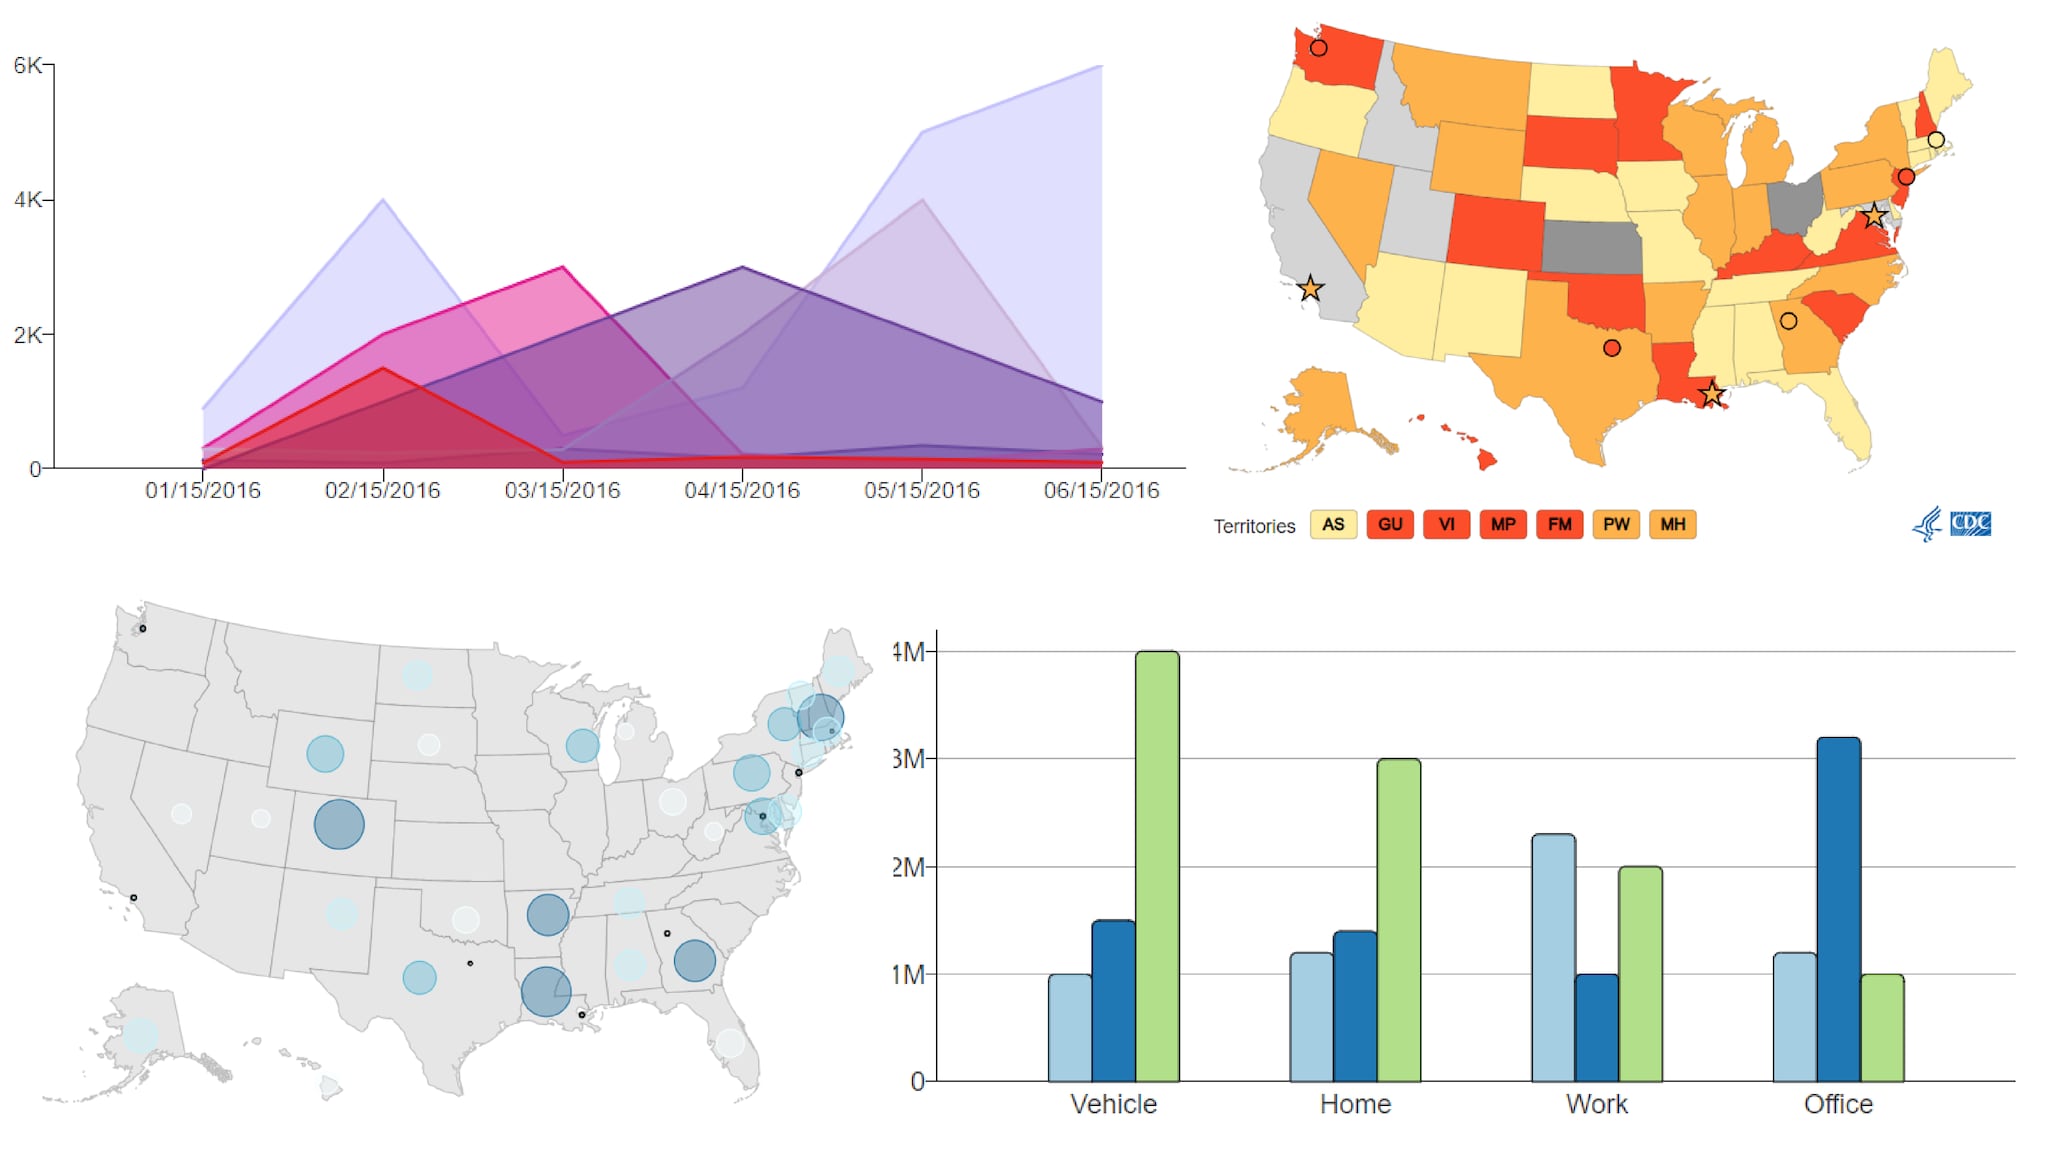
The CDC Open-Source Visualization Editor is a data visualization module type that lives in the WCMS.
Use the gallery listing to see the different ways CDC uses COVE to create visualizations
Explore the configuration panels that change the function and appearance of the visualizations.
Dashboards offer the ability to use a set of data to drive multiple visualizations simultaneously.
What's New - Release Notes
Find out more
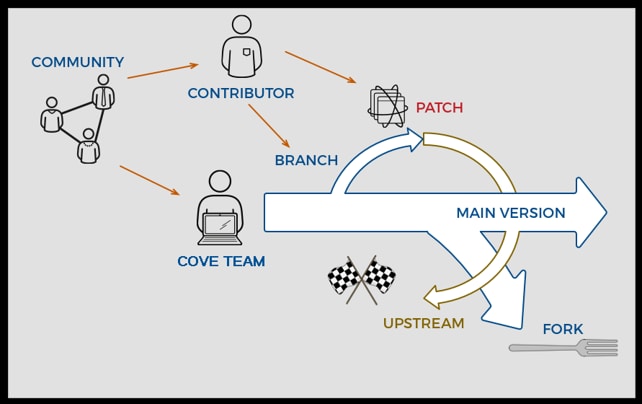
Developers inside and outside the agency are welcome to contribute to our Open-Source code.
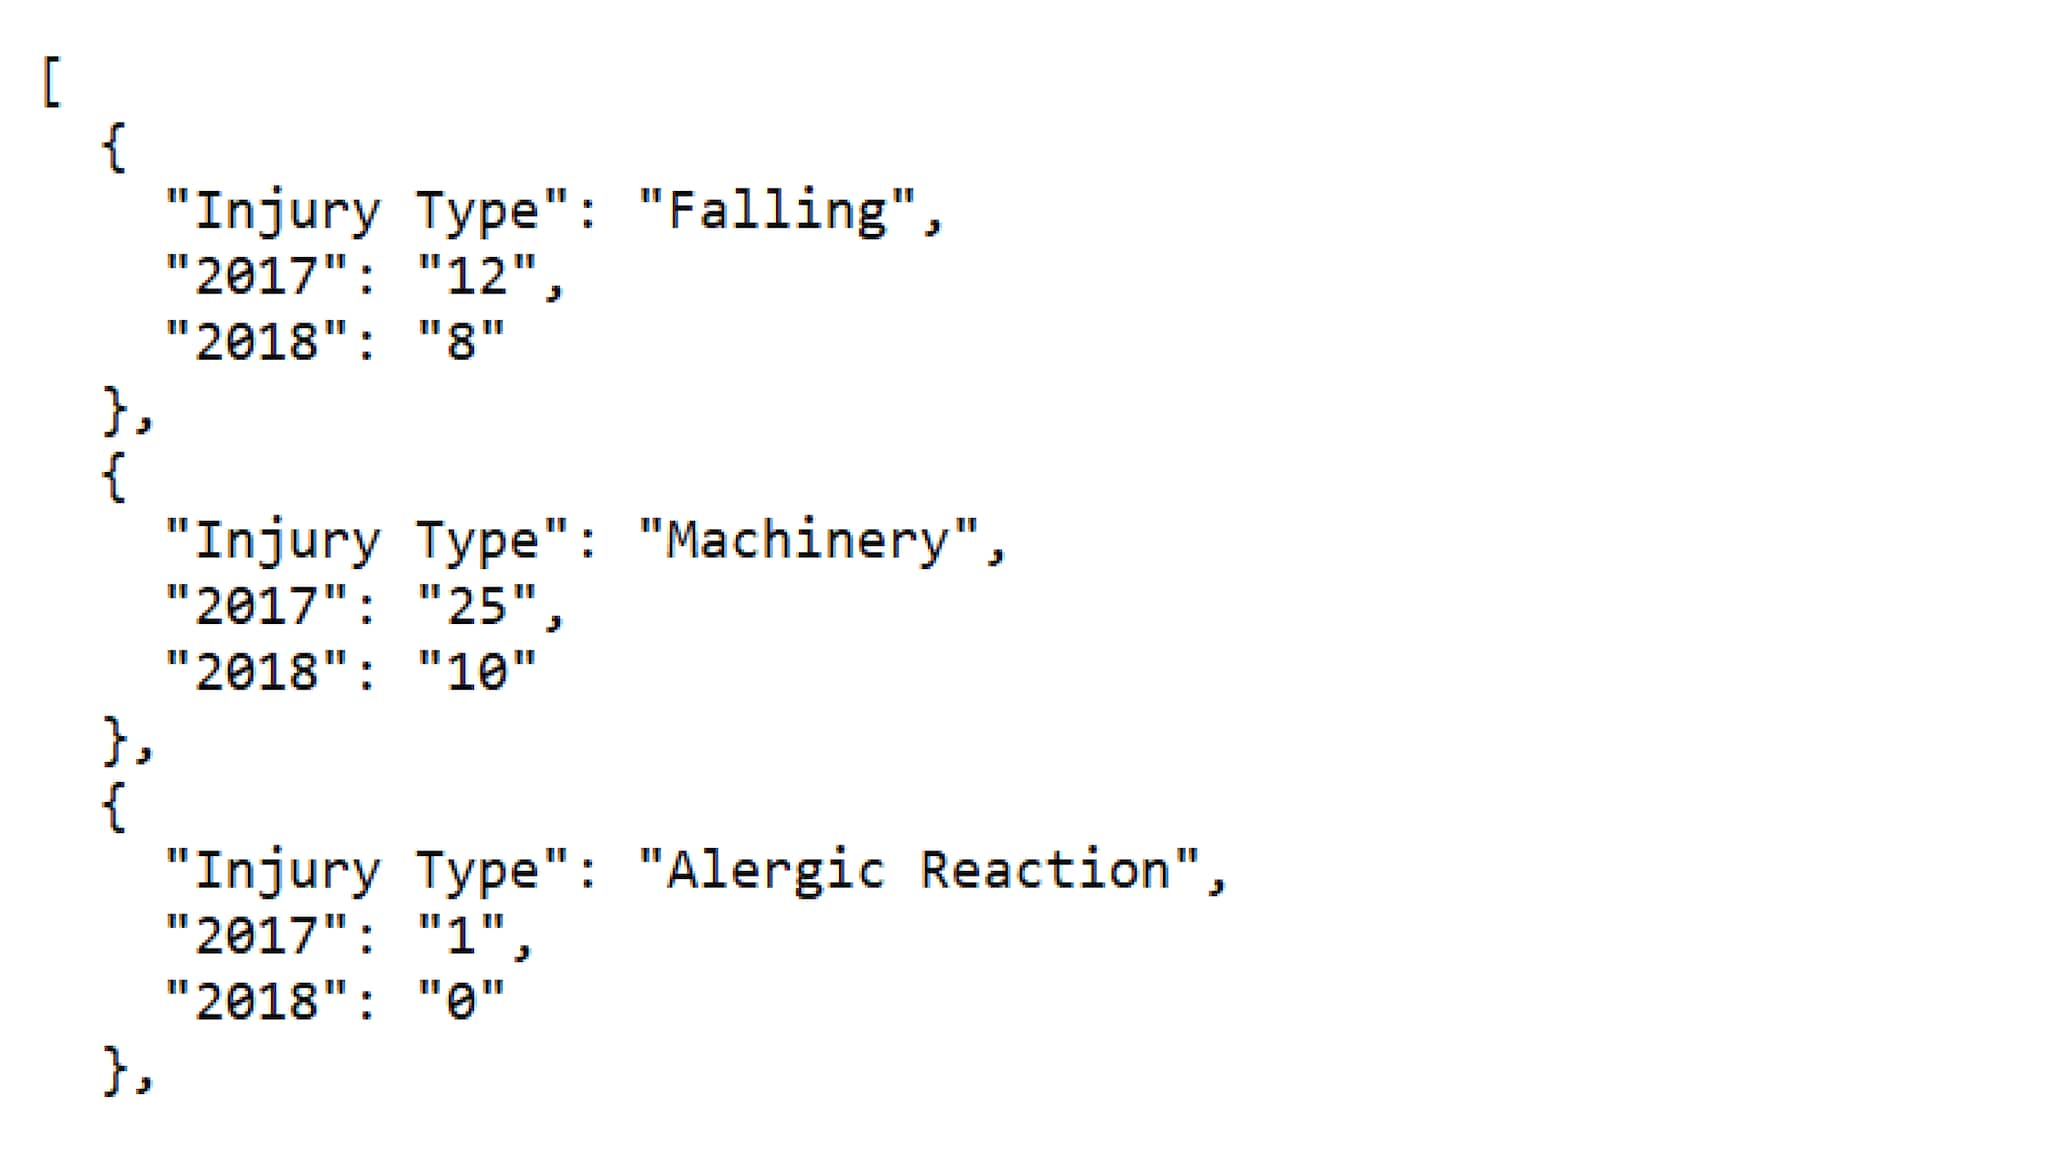
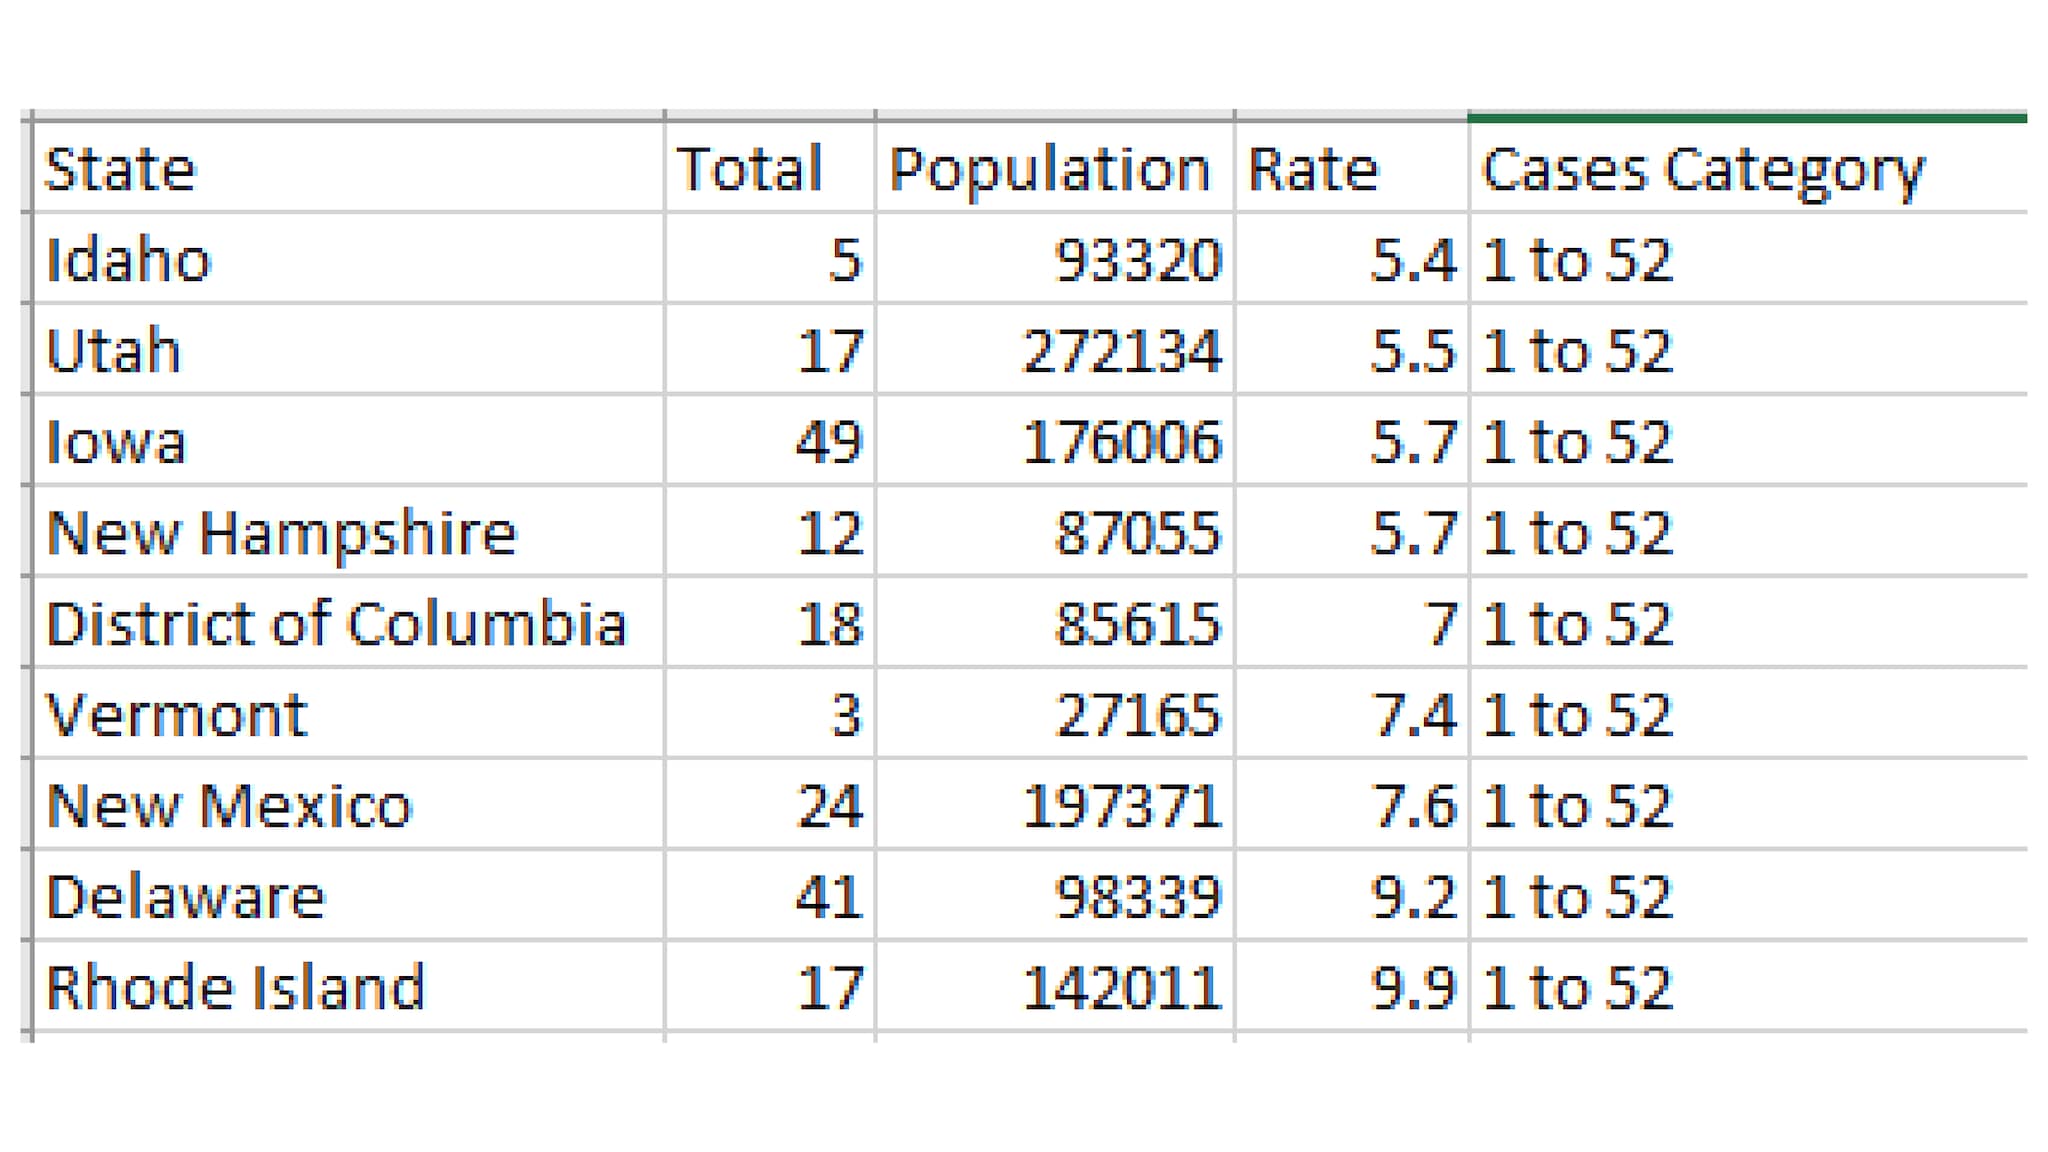
Data loaded into COVE must meet configuration requirements to be converted into a visualization.
Changes made to the Source Data File will update a visualization, but there are restrictions.


