Key points
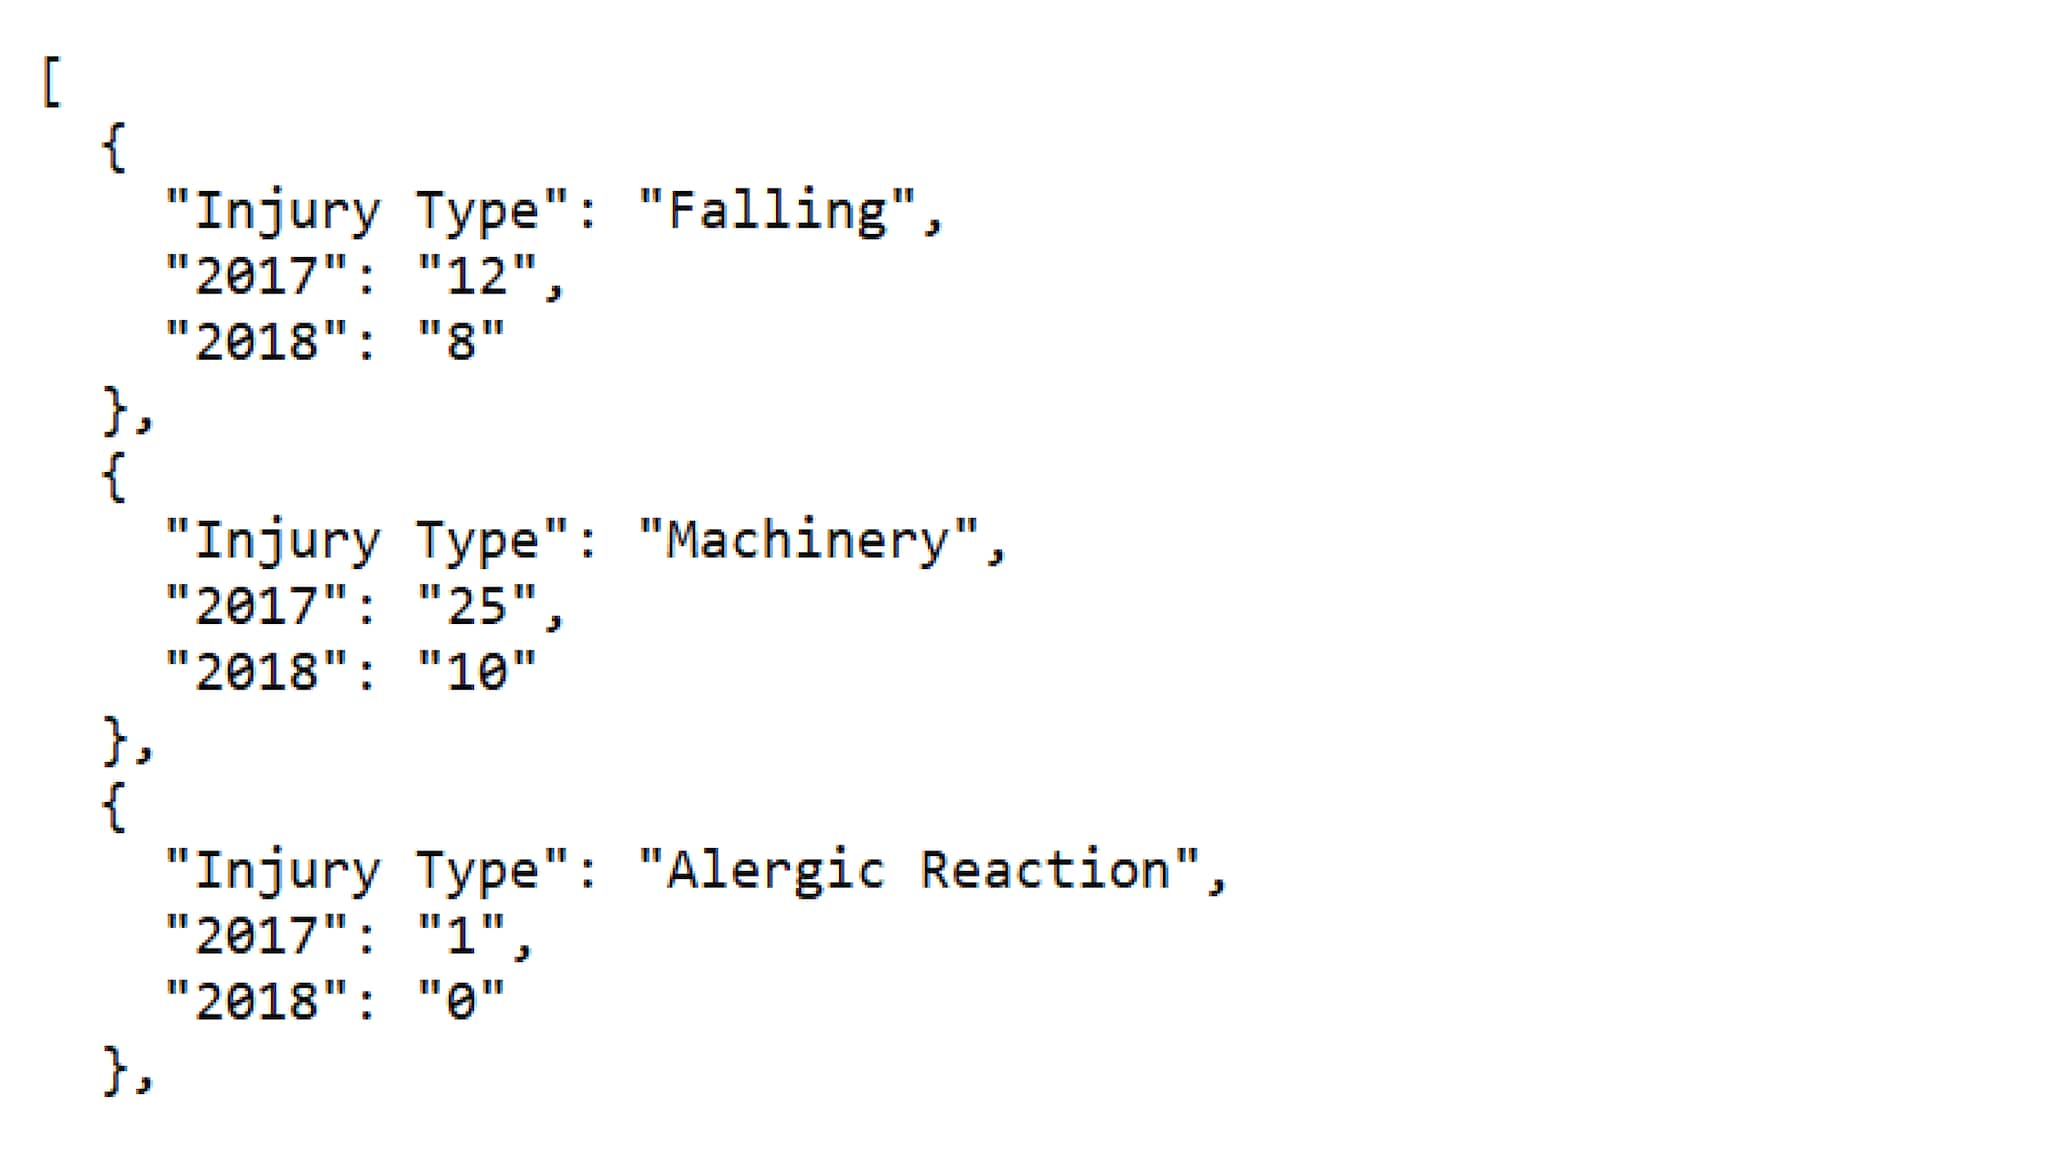
- The file types the COVE editor accepts are CSV and JSON.
- Vertical and Horizontal aligned data can be used.
- The COVE editor is a data visualization tool, not a data manipulation tool.
- Incomplete or erroneous data formatting will frustrate the build process.

About Data and the COVE editor
Whether automated or manually created, the data loaded into the COVE editor needs to meet a specific set of configuration requirements to be converted into a visualization.
The COVE editor is a visualization building platform. It is currently not a data manipulation tool. You can use URL filtering, select specific portions of your source data, and add labels or pre/suffixes in the build process, but the current version of the COVE editor cannot make changes to the data formatting or values.
General Data guidance
File types accepted
The file types the COVE editor accepts are CSV and JSON. The data can be manipulated in many different software options, but the final result needs to be CSV or JSON.
CSV Orientation
Your CSV files can be either Vertical or Horizontally oriented. Some filtering and build options may require a specific orientation. Planning ahead can be beneficial when considering complex visualizations and user interactions.
Columns
Data Column Labels: Labels placed in the first row of a column are used in selecting data for your visualization. Use concise column labels to avoid issues in the editing process.
- A FIPS number is required for each county. FIPS stands for Federal Information Processing Standards.
- Make sure FIPS Code for each county contains the full 5 characters. States like Alaska may drop the lead zero when imported into Excel as a spreadsheet. Formatting the cells as "custom" from the category list and then overwriting the general option with "00000" will add the leading 0 back to any number. The data must then be exported as a .CSV file type to retain the numbers for use in the editor.
Extra Data Columns: Not every column needs to be used for your visualization. If you select the vertical orientation, you'll find the option to add an additional columns. Adding additional columns in this way allows you to share additional information with your users in hovers and data tables.
Data fields
Prefixes and Suffixes - Do not include these to your Source data as it will disrupt the editor's interpretation of the data. There are fields in most visualization configuration panels that will allow you to add Prefixes and Suffixes to the data in the visualization and data table.
Symbols: Some symbols can be included in a categorical data set like "< > -". The editor will only render specific symbols. Others may break the visualization. One specific example is the use of longer em dash (—) and shorter en dash (–). The COVE editor will only display the shorter en dash (–) in the visualization and data table.
Commas: Data columns containing numerical data should not include commas. For example: "10,345" should be included in the data as "10345". Commas can be added from within the editor in the configuration of the visualization to make the numbers easier to read for the page user. Numerical data loaded with commas may display in the visualization, but can display incorrectly in the data table.
Geographic information for maps: Currently, the COVE editor supports HHS Regions, FIPs codes, State and County names, and longitude/latitude data. Look up each type of map in the Visualizations Gallery to learn more about each.
Importing Data
Note: The visualization editor has sample data that can be selected, allowing you to experiment with the various configuration options. This example data can be loaded into the editor by clicking the hyperlinks.
- You can Import data in one of three ways:
- Drag and drop a supported data file into the area marked with a document icon
- Select a file from your computer using the blue hyperlink.
- Load data from a URL by selecting "Load from URL" (Note that if you select Load from URL, you can also check "Always load from URL" to keep the chart data in sync with the data source.) This causes the data to load from the URL endpoint each time the visualization is rendered. Enter a user-friendly name for the dataset before loading.
- If formatted correctly, your data will populate in the "Data Preview" on the right. If the editor detects issues in the file or file type, a warning box will appear under file area with the detected issue.
- Select the Orientation of your data as either Vertical or Horizontal.
- If your data is horizontally listed or has multiple data series represented, you may need to make additional selections in the data orientation options below the data import fields before progressing to the Visualization Type. Simply select the options that best fit your data.
- Click on the "Configure your visualization" button that appears after those selections are made. This will take you to the "Configure" tab.
Notes on loading from a URL
Maps and Geographic Data
Special guidance for Map data can be found on the General Map Guidance gallery page.
