At a glance
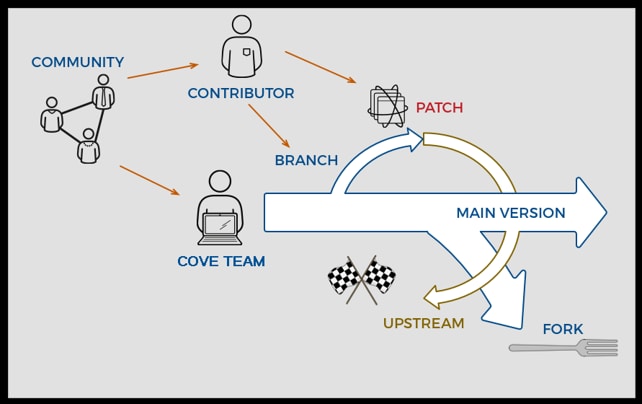
- COVE was built to be open-source.
- It's code base is widely available for contribution and use through GitHub.

Introduction
One of the goals for creating a data visualization tool for CDC was to make it open-source. This allows centers around the agency to help make the tool the best it can be as a health communication tool, and also open the code to public contribution and use.
- Developers inside and outside the agency are welcome
- To find out more about contribution visit our GitHub and read the CONTRIBUTING.md
Why participate
Contributing to COVE improves the way CDC shares health information with the public. Each contributor can create new features and fixes to functionality.
Contributing
The best place to start getting information on contributing to the COVE project is to visit the GitHub and read the CONTRIBUTING.md. That document will help you find out about:
- Contribution
- Requesting new features and bug fixes
- Asking for help
- Setting up a project
- Branching Information
- and Opening a Pull Request
Visualization Framework
Most developers will recognize the framework we've selected for this project, but some of the key decisions we've made are listed below.

Visualizations Library:
- D3.js
- The most popular JavaScript library for visualizations
Abstraction Layer:
- VISX
- Simplifies the use of D3.js, but at a low enough level to allow for CDC-specific customizations
User Interface Library:
- React
- Pre-built components for faster UI development.
We utilize the React Visx library to streamline our visualization process, while React is employed for various UI enhancements throughout the application. Developed as Open Source and integrated into CDC's Template Package and WCMS.
