Key points
Data sources
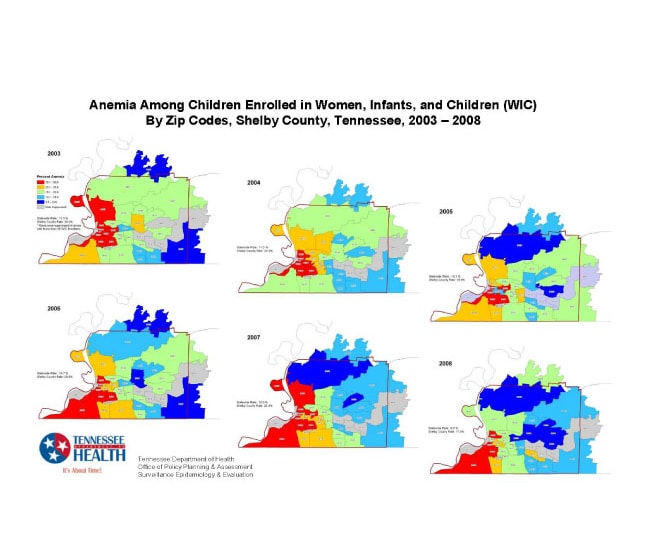
The highest anemia rates tended to occur in and around downtown Memphis and south of downtown. Lower rates tended to be observed in the suburban and rural areas east and north of downtown. In general, geographic variations in anemia rates are consistent from year to year. The anemia rates for certain ZIP codes show fluctuations over time. GIS maps by zip codes help visualize geographical disparities in anemia rates among WIC enrollees in Shelby County. They also help identify ZIP code areas with relatively higher or lower anemia rates.
ArcGIS 9.3; SAS 9.1
The Special Supplemental Nutrition Program for Women, Infants, and Children (WIC).
This study presents anemia rates among WIC enrollees aged 9 months and older in Shelby County by zip code area and year. Anemia is defined as hemoglobin levels of less than 11 mg/dl. We analyzed the most recent hemoglobin measurement for each child enrolled in WIC for each of the years from 2003 – 2008 to determine the rate of anemia for each zip code area. Each enrollee’s resident address was geocoded to determine zip code location. Rates for zip code areas with less than 50 WIC enrollees were suppressed due to concerns about statistical reliability. We used ArcInfo version 9.3 to produce all maps.
Yinmei Li, Director, Surveillance, Epidemiology & Evaluation, Tennessee Department of Health
(615) 741-8190
yinmei.li@tn.gov
Anemia among Children on Women, Infants, and Children (WIC) by Zip Codes, Shelby County, Tennessee, 2003-2008 Croom, Fred; Li, Yinmei. Tennessee Department of Health Office of Policy, Planning and Assessment Surveillance, Epidemiology and Evaluation, [TODAY’S DATE]. Accessed from the Centers for Disease Control and Prevention's Chronic Disease Map Gallery.

