Key points
Data sources
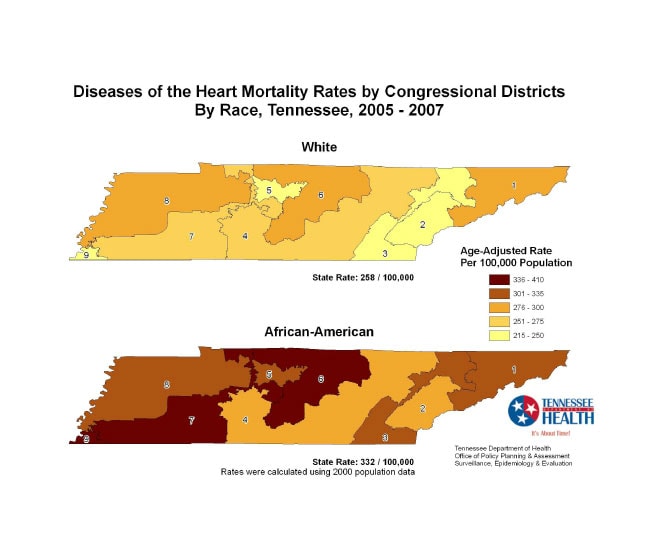
These maps help visualize variations of heart disease mortality rates among U.S. Congressional Districts and among racial and sex groups in Tennessee.
ArcGIS 9.3; SAS 9.1
Tennessee Death Statistical System 2005-2007; U.S. Census Bureau 2000 Population.
Age-adjusted mortality rates were calculated from the 2005-2007 Death Statistical System provided by the Tennessee Department of Health, Division of Health Statistics. Data were for Tennessee residents with underlying cause of death recorded as diseases of the heart (ICD10 codes of I00-I09, I11, I13, I20-I51). Because 2005-2007 population data by U.S. congressional districts were unavailable, 2000 population data were used instead as the denominators to calculate mortality rates. As a result, the rates are in general higher than the actual mortality rates in the population. Resident addresses were geocoded to determine congressional districts. 99.96% records were able to be successfully geocoded. Rates were age-adjusted to the 2000 U.S. standard population using the direct method. Race classifications of “white” and “African American” refer to individuals regardless of Hispanic origin. In some districts, mortality rates for African Americans were based on relatively small numbers of deaths. These results should be interpreted with caution.
Yinmei Li, Director, Surveillance, Epidemiology & Evaluation, Tennessee Department of Health
(615) 741-8190
yinmei.li@tn.gov
Diseases of the Heart Mortality Rate by U.S. Congressional District, Tennessee 2005-2007 Croom, Fred; Li, Yinmei. Tennessee Department of Health Office of Policy, Planning and Assessment Surveillance, Epidemiology and Evaluation, [TODAY’S DATE]. Accessed from the Centers for Disease Control and Prevention's Chronic Disease Map Gallery.

