About
Background
The Ethiopian Ministry of Health declared an outbreak of Marburg virus disease (Marburg) on November 14, 2025. As of December 22, 2025, there have been 14 laboratory-confirmed cases, including 9 deaths, in the country's South Ethiopia and Sidama regions. This is the first reported outbreak of Marburg in Ethiopia.
To inform preparedness and decision-making, we outline three plausible scenarios for the outbreak in Ethiopia over the next three months, including implications for the United States. The Center for Forecasting and Outbreak Analytics (CFA), in collaboration with subject-matter experts from the National Center for Emerging and Zoonotic Infectious Diseases (NCEZID) and CDC's Country Office in Ethiopia, developed these scenarios by integrating insights from previous outbreaks of viral hemorrhagic fevers (VHFs). We use a simple model to interpret what the number of observed cases may mean about the true number of infections so far and how the outbreak may progress in the short-term future.
In a recent rapid risk assessment, CDC assessed the current risk posed by the outbreak of Marburg in Ethiopia to the U.S. general population as low, with moderate confidence.
Potential outbreak scenarios
We outline three plausible scenarios for how the outbreak in Ethiopia could progress over the next three months:
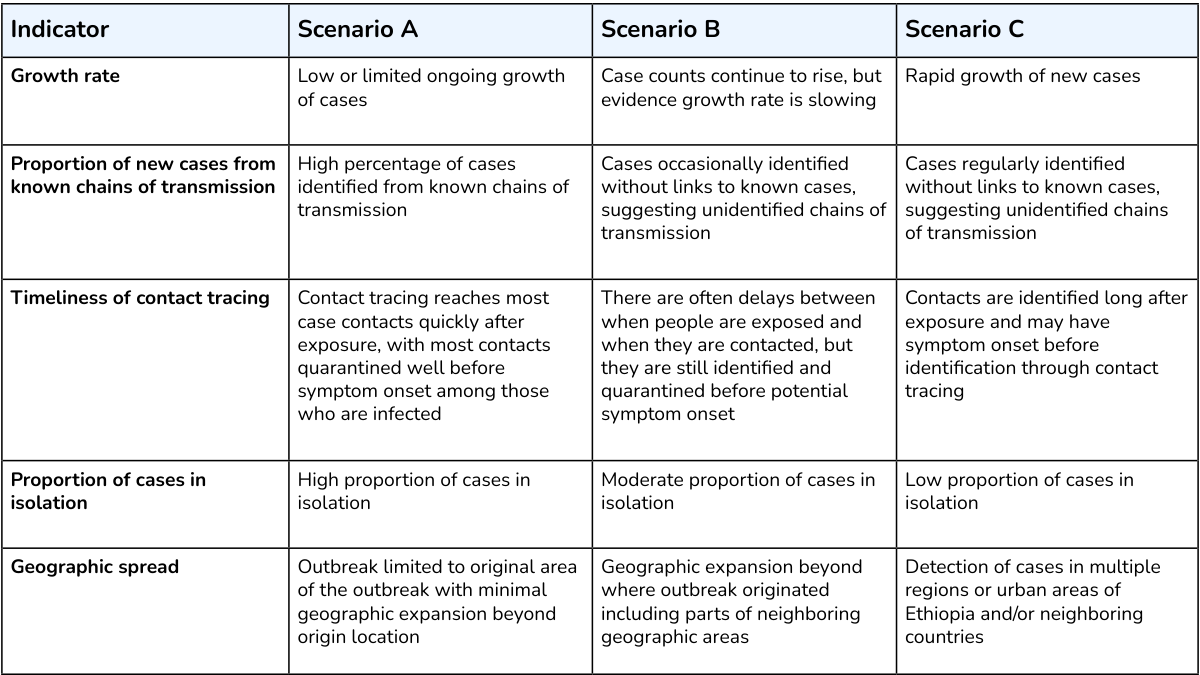
- Scenario A: An outbreak of Marburg (<30 total cases) with no ongoing transmission in three months. More than half of all previous known Marburg outbreaks have resulted in fewer than 30 cases and lasted less than three months. In this scenario, Ethiopia could experience limited spread among healthcare and household contacts, similar to the 2023 Tanzania outbreak.
- Scenario B: A medium-sized outbreak of Marburg (30-100 total cases). There may be ongoing transmission in three months, with indications that the outbreak is declining. In this scenario, Ethiopia could experience expanded transmission among healthcare workers and household contacts of cases, similar to the 2024 outbreak in Rwanda. In this scenario, there may be some spread to neighboring countries.
- Substantial resources may be needed for rapid detection of Marburg, isolation of cases, and contact tracing as the number of cases in the outbreak increases.
- The risk of importation to the United States may increase if the outbreak in Ethiopia grows or if it spreads to neighboring countries, due to increases in the number of returning healthcare workers or travelers from the region. Historically, the majority of VHF cases in the United States during outbreaks in other countries have been among returning healthcare workers and travelers.
- Scenario C: A large outbreak (more than 100 cases) with evidence of exponential growth in three months. In this scenario, Ethiopia would likely experience some sustained community transmission, as was observed in the 2004-2005 Angola outbreak. This scenario carries the highest risk of spread to neighboring countries, though within-county transmission remains most likely.
- In this scenario, Ethiopia, and possibly neighboring countries, would require substantial outbreak response resources over a significantly longer period of time, including additional medical staff and facilities.
- Of the three potential scenarios, importation to the United States is most likely to occur in this scenario. If a large outbreak occurs in Ethiopia, the public health impact for the U.S. general population may be significantly higher. Additionally, there may be increased need for U.S. assistance and increased concern in the United States as the outbreak in Ethiopia grows.
Below, we identify a set of indicators and associated levels that could be used to assess which scenario best captures a Marburg outbreak. In the early stages of an outbreak, accurately assessing all indicators is not always possible. Not all indicators need to be met for the assessment of a given scenario, and we rely on expert judgment to determine which scenario is most likely to occur.
Assessment of current scenario
As of December 22, we assess the current outbreak is most closely following Scenario A. We have low confidence in this assessment. There remains a chance of Scenario B, which should be considered for preparedness activities. [Note: as of publication on January 23, 2026, we no longer believe Scenario B is likely to occur.]
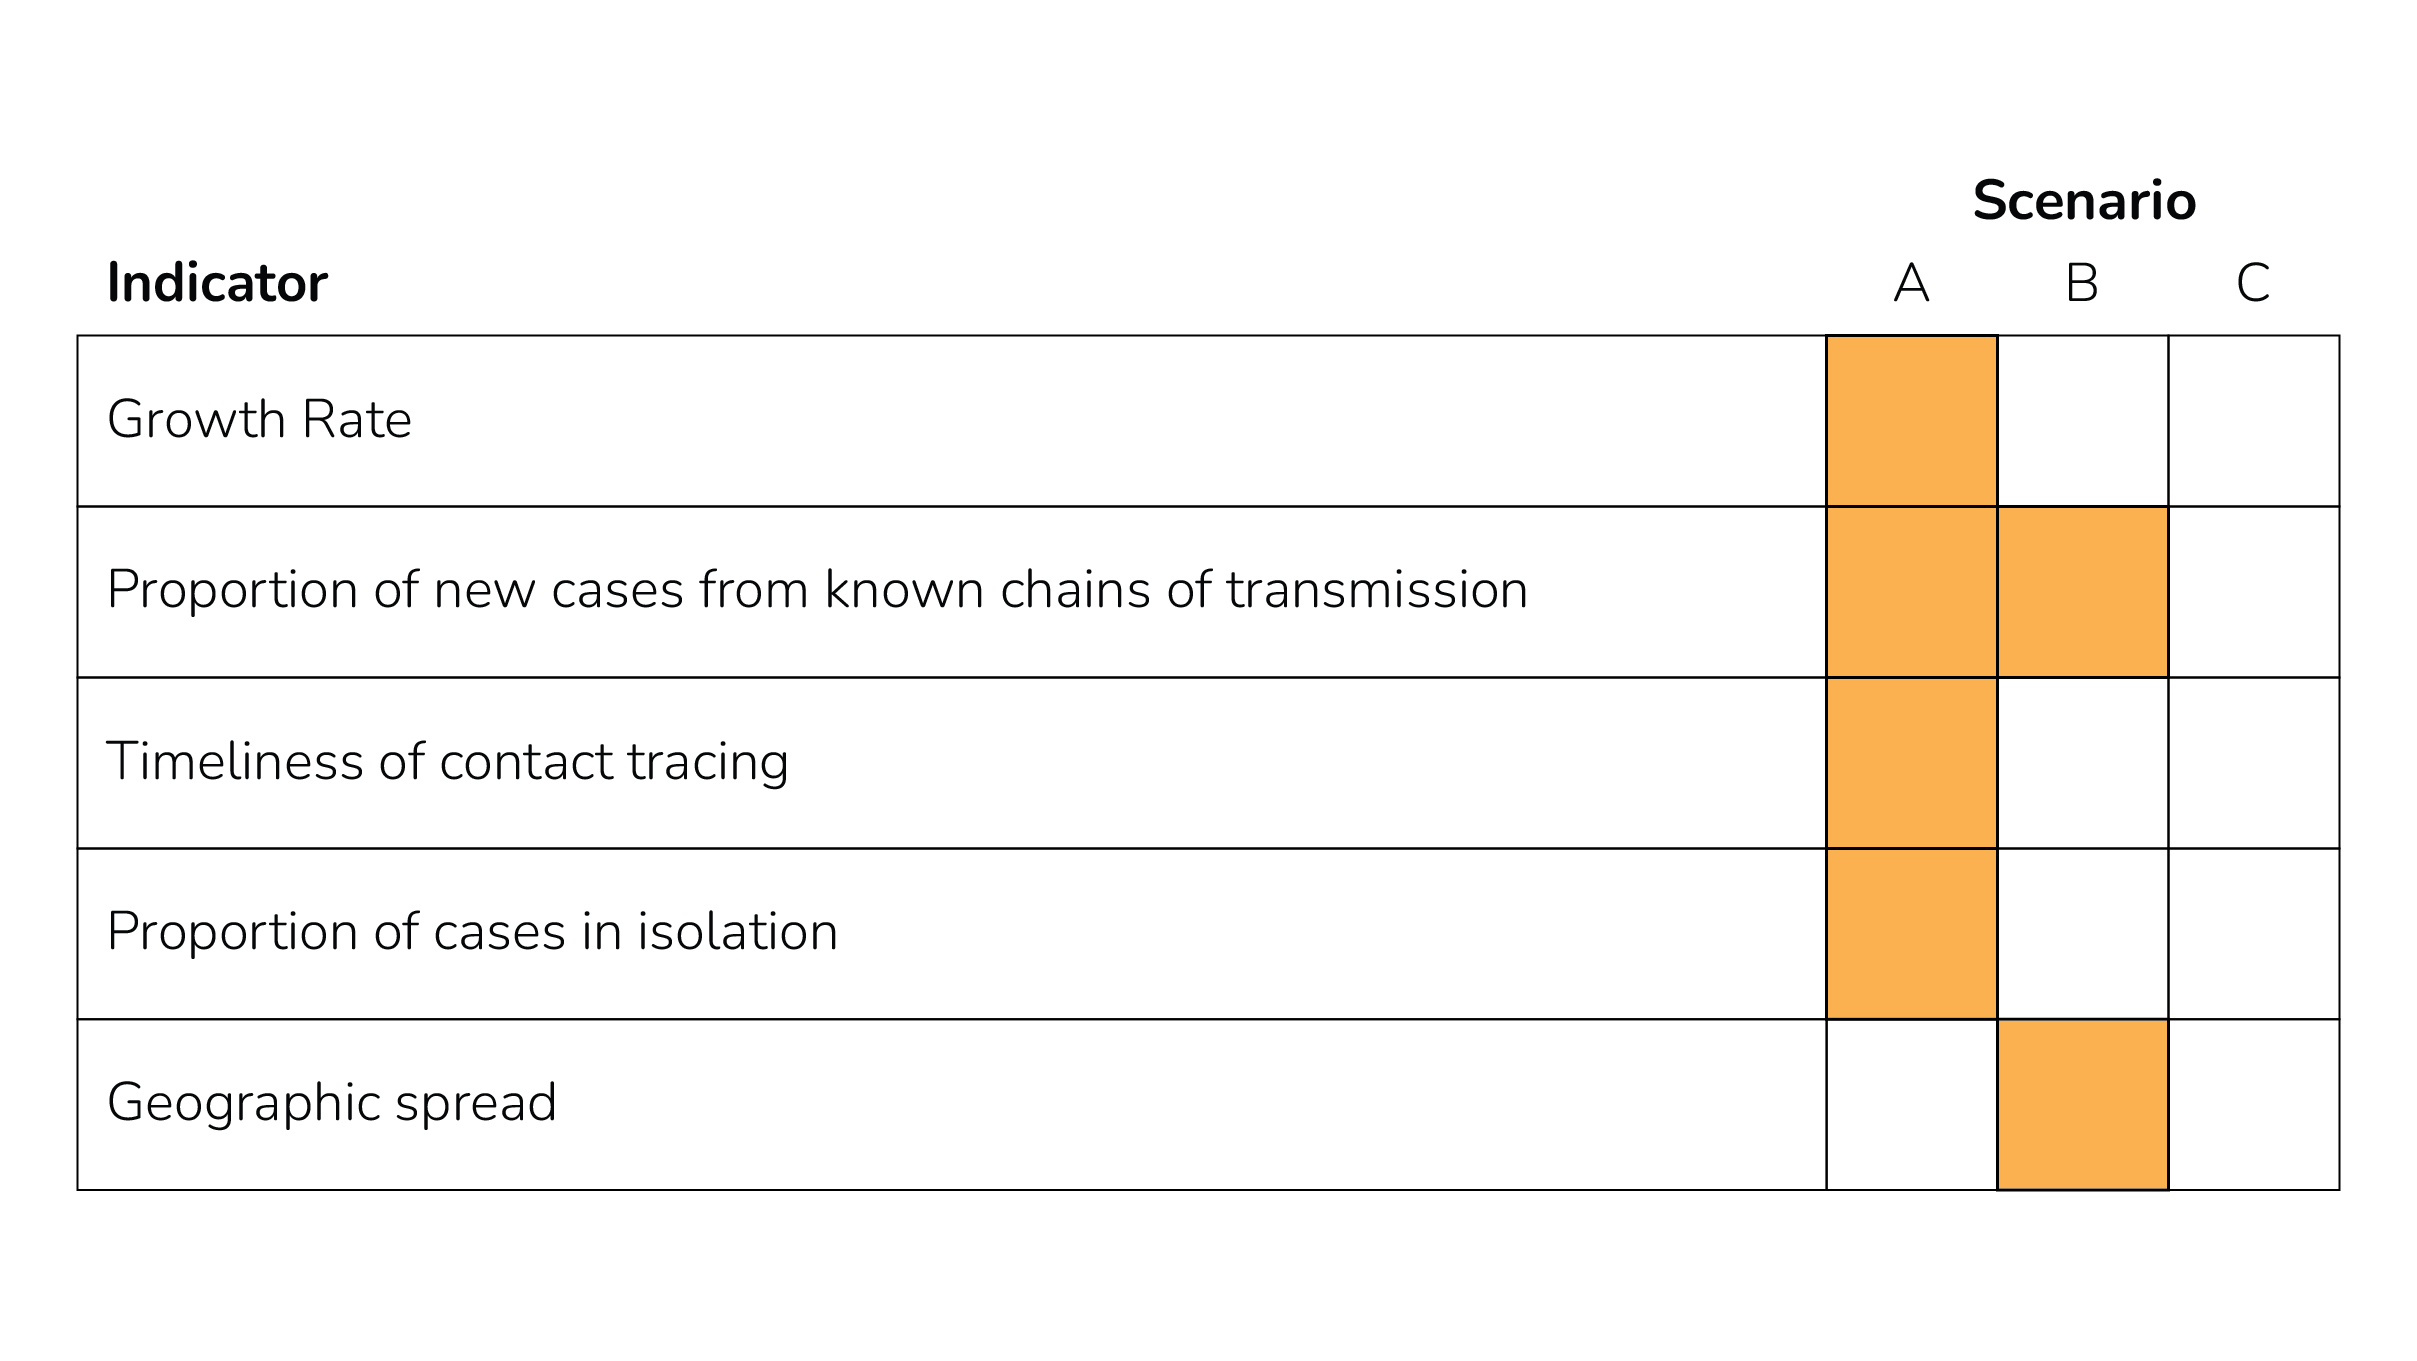
- Growth rate: The growth rate appears to have slowed, with only two new cases identified since the beginning of December.
- Proportion of new cases from known chains of transmission, Timeliness of contact tracing: The Ministry of Health of Ethiopia is conducting contact tracing – several hundred contacts have already been traced, and many continue to be quarantined and monitored. This suggests a concerted contact tracing effort; thus, although specific data on the timeliness are not yet available, we assess timeliness of contact tracing as fitting scenario A. Given this contact tracing effort, although specific data are not yet available, we estimate the proportion of new cases from known chains of transmission as either scenario A or B.
- Proportion of cases in isolation: The government of Ethiopia has established treatment centers for Marburg, and reports isolating suspected cases.
- Geographic spread: The first cases were reported in Jinka Town, in South Ethiopia Regional State. At least one case has subsequently been reported in the city of Hawassa, in Sidama Region.
While we assess that the outbreak is likely following Scenario A and there is a chance of Scenario B, we note it remains possible that a much larger outbreak could occur; historically, even very large VHF outbreaks began as small, slowly growing outbreaks. We have low confidence in this assessment, due to key areas of uncertainty which we have outlined below.
Modeling insights
Modeling can help us explore which scenario is most likely, given the available information. CFA developed a mathematical branching process model to explore what observed cases may tell us about the true number of infections, and what this means for how the outbreak may progress. The model projects total case numbers over weeks and months under different assumptions about the effectiveness of outbreak surveillance efforts.
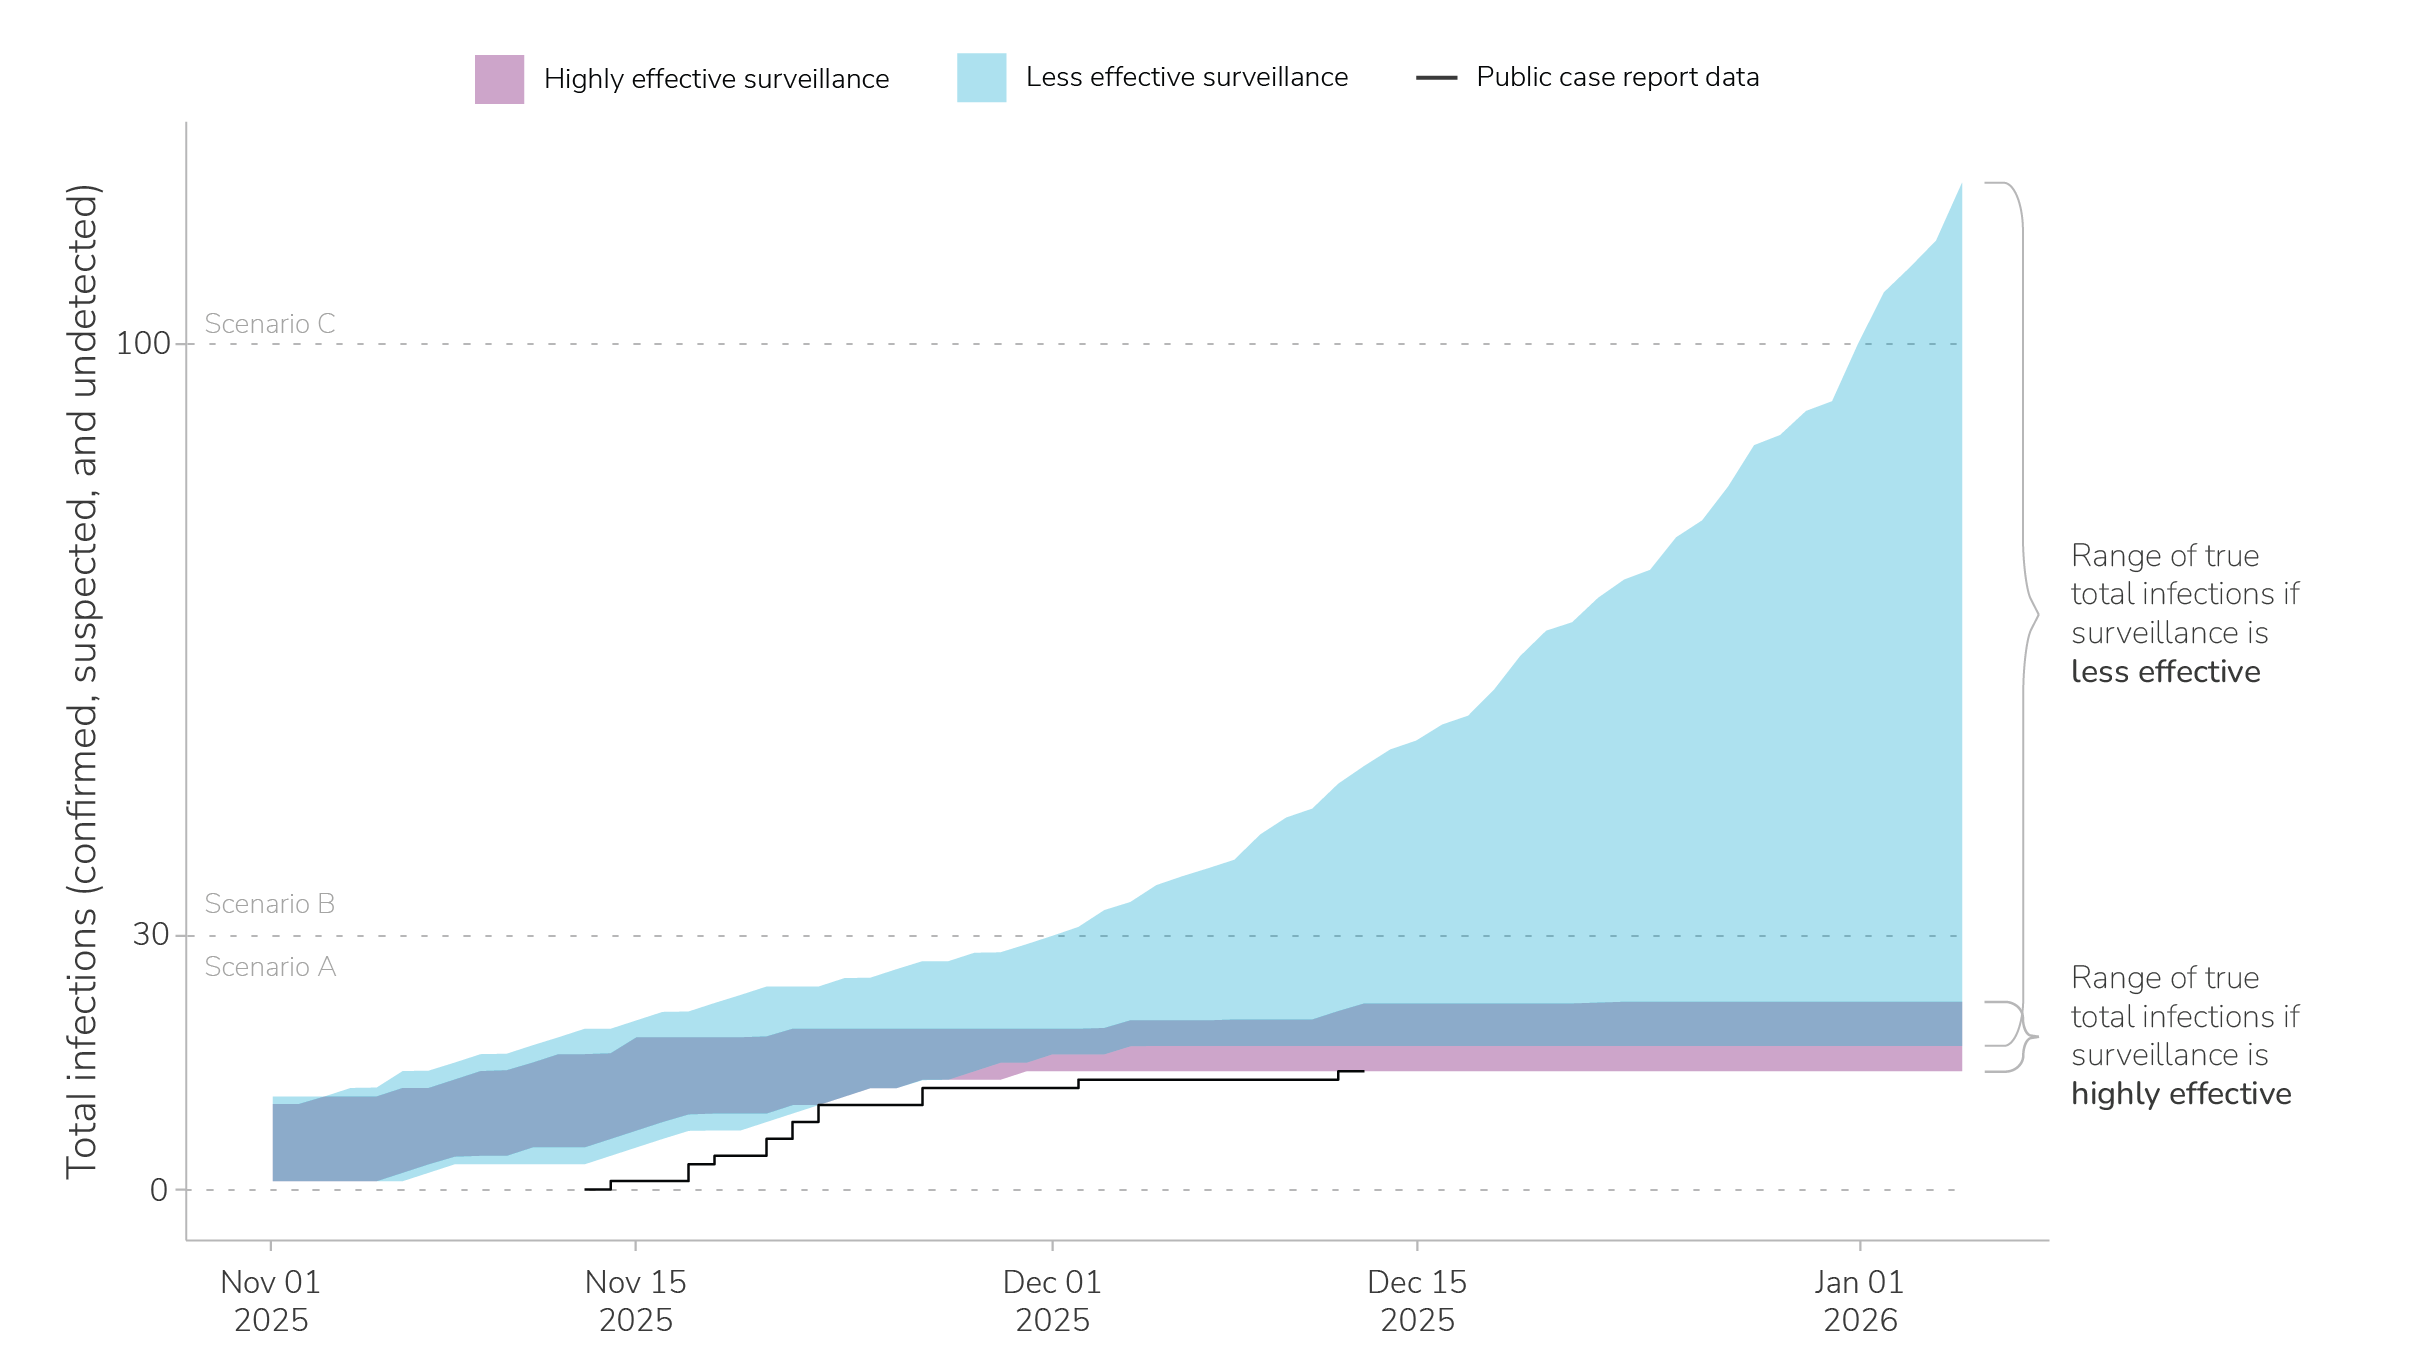
We consider two possible situations: one in which the community surveillance and contact tracing efforts in Ethiopia are highly effective at identifying cases, and one in which they are less effective at identifying cases (Appendix: Additional modeling methods).A This model is fit to the cumulative number of confirmed cases reported by the Ethiopia Ministry of Health – 14 total cases from November 14, 2025 through December 13, 2025 (Figure 2, black line).
The effectiveness of surveillance affects the projected range of case numbers in two ways: First, more effective surveillance means we are more confident that a higher proportion of true infections are reported. Second, more effective surveillance means more people with Marburg infections can be isolated, reducing onward transmission. In this way, better surveillance leads not only to increased certainty about the state of the outbreak, but also a better outbreak response and more controlled transmission.
With highly effective surveillance, our model estimates the 14 confirmed cases is likely to result from an outbreak of between 14 and 22 true total infections (90% range, Figure 2, in purple). With less effective surveillance systems (shown in blue), the 14 confirmed cases could be the result of an outbreak with between 17 and 50 true total infections (90% range, Figure 2, in blue).
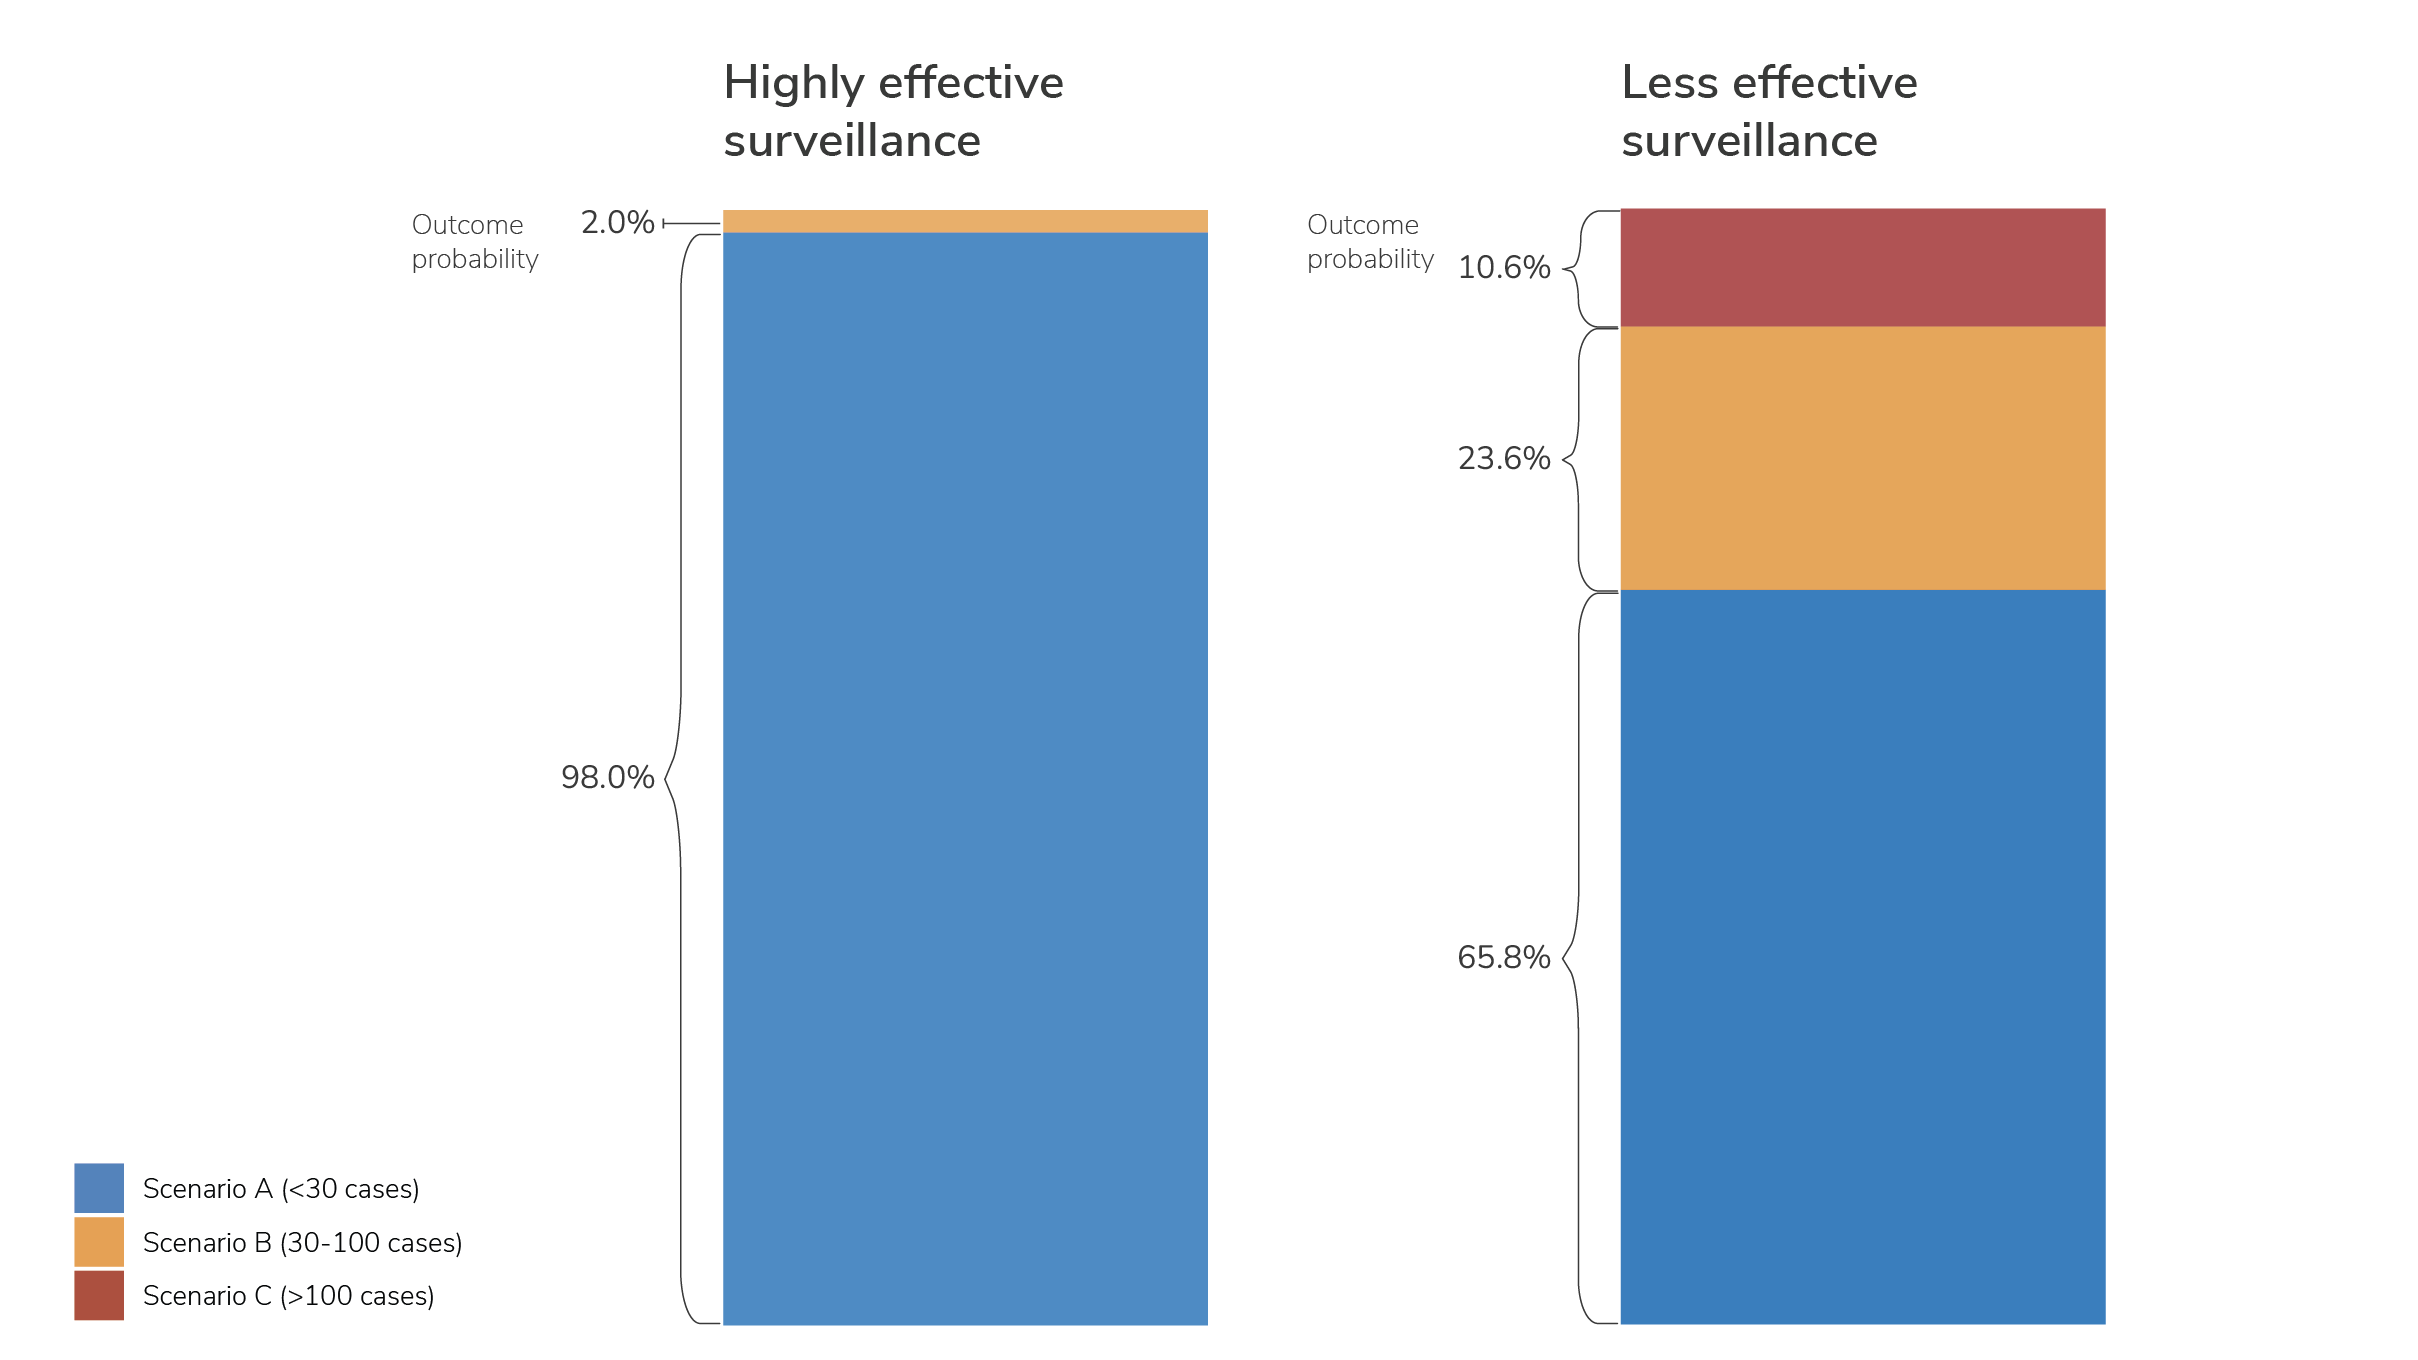
We can also use this model to consider how the effectiveness of surveillance impacts the progression of the outbreak over time. We examined the relative probabilities of the three outbreak scenarios – A, B, and C – at 90 days (3 months) after the first reported case (Figure 3). Model results show that when surveillance is highly effective, an outbreak with greater than 30 cumulative infections (Scenario B or C) is much less likely. A limitation of this model is that we assume the effectiveness of surveillance is fixed throughout the outbreak, which is not necessarily the case throughout an outbreak. Even if surveillance was only moderately effective until now, improving the efficacy of surveillance is likely to reduce the probability of an outbreak falling into either Scenario B or Scenario C.
Key uncertainties
This scenario assessment is intended to provide a high-level overview of how the outbreak could progress during the next three months. There are several areas of uncertainty that could change our assessment of this outbreak and which scenario it is most consistent with, including:
- The effectiveness of ongoing surveillance efforts (contact tracing and enhanced community surveillance). Our modeling work highlights how the effectiveness of surveillance influences both our ability to assess the current state of the outbreak and the likely progression of the outbreak. While some countries have extensive experience responding to VHF outbreaks and establishing highly effective surveillance, this is the first reported outbreak of Marburg in Ethiopia. Nevertheless, the Ministry of Health in Ethiopia has responded quickly and is actively collaborating with health organizations and regional partners experienced in VHF outbreak responses.
- The potential for undetected chains of transmission. While the Ethiopian Ministry of Health has reported extensive laboratory testing, the exact origin of this outbreak has not yet been reported, and it remains possible that there could be undetected chains of transmission that are not captured even by highly effective contact tracing efforts.
- The potential for spread outside of the currently affected regions in Ethiopia. While the outbreak was first detected in Jinka Town, cases have subsequently been reported in the bigger city of Hawassa. Spread to larger cities, such as the capital, Addis Ababa, or to refugee camps in southern Ethiopia along the border with South Sudan could change our assessment.
- The availability and effectiveness of medical countermeasures. While there are no approved vaccines or therapeutics for use in a Marburg outbreak response, there is an investigational vaccine being trialed in Ethiopia for individuals at high exposure risk. Treatments such as an investigational antiviral and investigational monoclonal antibody therapeutic have also been deployed in this outbreak.
Additional background
Marburg virus disease is a rare, severe viral hemorrhagic fever in the same viral family as Ebola virus. The Marburg virus is most commonly found in sub-Saharan Africa. To date, there have not been any reported cases related to this outbreak outside of Ethiopia, and the Ethiopian Ministry of Health reported that genomic sequencing suggests this is the same strain of Marburg virus reported in previous outbreaks in other East African countries.
The Marburg virus is found in Egyptian rousette fruit bats and can spread from infected bats (through saliva, urine, and feces) to people. Though there has not been a reported outbreak of Marburg in Ethiopia previously, this bat species is native to southern Ethiopia. Once the disease has "spilled over" from wildlife to people, people who are sick can spread the disease to others (person-to-person). Infections are transmitted through direct contact with bodily fluids (through broken skin or mucous membranes in the eyes, nose, or mouth) or through contaminated objects (such as bedding or medical equipment).
People with Marburg virus disease usually start getting sick 5 to 10 days after infection (range of 2-21 days). Symptoms can appear suddenly and may include fever, vomiting, diarrhea, rash, and severe bleeding. There are no specific treatments or vaccines that are FDA-approved for Marburg virus, though candidate vaccines and treatments are being investigated and deployed in clinical trials.
Groups at higher risk of acquiring Marburg virus disease include:
- People caring for individuals sick with Marburg virus disease without proper protective equipment and procedures, including healthcare workers
- People attending funerals and/or participating in rituals such as preparing bodies for funeral or burial
- People in contact with Egyptian rousette bats or their excretions in enzootic countries
- People in contact with infected nonhuman primates in enzootic countries
Though there are no current cases outside of Ethiopia, CDC recommends that U.S. clinicians obtain a detailed travel history from patients with an acute febrile illness, especially those who have been in affected areas of Ethiopia recently, while also ruling out more common causes of febrile illnesses.
Vaccine
There are no licensed vaccines for Marburg. However, as of December 4, 2025, the Sabin Vaccine Institute had sent more than 640 doses of its investigational cAd3-Marburg Vaccine to Ethiopia. This is in collaboration with the Ethiopia Ministry of Health, the U.S. Department of Health and Human Services through the Administration for Strategic Preparedness and Response's (ASPR) Biomedical Advanced Research and Development Authority (BARDA), the Armauer Hansen Research Institute (AHRI), and other global health partners. These doses are being used in a Phase 2 clinical trial for high-risk healthcare and frontline workers and case contacts.
ASPR announced that up to 2,500 doses of this vaccine will be provided to Ethiopia in response to this outbreak.
Treatment
Currently, there are no licensed treatments for Marburg. Treatment is generally limited to supportive care. This includes rest, hydration, managing oxygen status and blood pressure, and treatment of secondary infections. However, investigational therapeutics have been deployed to support patient post-exposure prophylaxis and treatment. As of December 3, 2025, 1,200 doses of remdesivir, an antiviral therapy with preclinical data for filoviruses, had been provided to Ethiopia by Gilead Sciences under an emergency use authorization from the Ethiopian Food & Drug Authority. Additionally, on December 4, 2025, ASPR announced the provision of up to 25 treatment courses of Mapp Biopharmaceutical's investigational MBP091 monoclonal antibody therapeutic to Ethiopia, and five treatment courses of MBP091 were received by Ethiopia on December 5, 2025.
Appendix: Additional modeling methods
We use a branching process model, which is a type of stochastic transmission model that models infected individuals only. We run the model repeatedly to account for random variability in disease transmission. This analysis was conducted using individual simulations of the model that had exactly 14 reported cases on day 30 of the outbreak (since the first confirmed case was reported) to align results with the outbreak in Ethiopia. We run 200 simulations of the model for each surveillance scenario.
In each generation of transmission, infected individuals can each infect a randomly generated number of additional individuals. We model three distinct pathways by which Marburg infections may be confirmed and isolated:
- By self-presenting to a clinic: This is the "baseline" level of VHF surveillance and is the only pathway that operates in the absence of a known outbreak. While this pathway is always operating, it is especially important at the beginning of an outbreak because the first confirmed case is necessarily detected through this pathway.
- Through case investigation and contact tracing: This applies only to contacts of known cases, after active surveillance efforts have started.
- Through enhanced community surveillance: This is a broad category intended to reflect all aspects of surveillance—except for contact tracing—that are implemented in response to an outbreak. Examples include house-to-house case searches, screening at checkpoints, and increased care seeking due to increased community awareness.
In this model, to show "highly effective" versus "less effective" levels of surveillance, we modify the strength of the latter two pathways jointly, as described in the Appendix Table 1, below.
| Parameter | Value(s) | Description |
|---|---|---|
| Contact tracing probability | Less effective: 50% Highly effective: 95% |
Probability that an infection is identified via contact tracing. For this, the infector must be a confirmed case and the infection is not identified through another route (e.g. community surveillance or clinical detection) first. |
| Contact tracing lag | 4 days | Mean of exponentially distributed time lag between when a case is confirmed to when that case’s infectee is quarantined (or isolated, if symptomatic) via contact tracing. |
| Community surveillance probability | Less effective: 30% Highly effective: 70% |
Probability that an infection is identified via community surveillance (assuming that the infection is not identified through another route first). |
| Community surveillance lag | 5 days | Mean of exponentially distributed time lag between symptom onset and detection/confirmation via community surveillance (this parameter implicitly includes test turn-around time). |
| Surveillance campaign lag | 2 days | Constant time lag between when the outbreak’s first case confirmation occurs and when contact tracing and community surveillance are implemented. |
The following parameters define the first pathway of detection (self-directed care seeking).
| Parameter | Value(s) | Description |
|---|---|---|
| Clinical detection probability | 35% | Probability that an infection is identified via clinical detection. For this, someone with Marburg virus disease must both self-report to a healthcare setting and be appropriately tested and receive a positive test result. Additionally, this assumes the infection is not identified through another route (e.g. contact tracing or community surveillance) first. |
| Clinical detection lag | 7 days | Constant time lag between symptom onset and care seeking. |
| Testing lag | 1 day | Constant time lag between care seeking and case confirmation. During this lag, a symptomatic patient is assumed to be hospitalized but not yet in a Marburg Treatment Center (MTC). This parameter also applies to potential cases that are already symptomatic when detected through other detection pathways (contact tracing and community surveillance). |
| Parameter | Value(s) | Description |
|---|---|---|
| Risk of clinical transmission | 1 | Relative risk measuring the effect of being in a clinical setting with undiagnosed Marburg on onward transmission; a value of 1 corresponds to no effect on onward transmission risk. |
| Risk of quarantine transmission | 0 | Relative risk measuring the effect of being in quarantine on onward transmission; a value of 0 corresponds to no onward transmission risk. |
| Risk of Marburg Treatment Center (MTC) transmission | 0 | Relative risk measuring the effect of being in an MTC on onward transmission; a value of 0 corresponds to perfect isolation (no onward transmission risk). |
| Marburg Treatment Center (MTC) transfer lag | 1 day | Constant time lag between when a case is confirmed and when the patient enters an MTC. This lag applies to all detection pathways. |
| Parameter | Value(s) | Description |
|---|---|---|
| Basic reproduction number, R0 | Lognormal prior with median 0.8 and interquartile range 0.60 to 1.06 | Mean number of secondary infections per infection. Instead of specifying a single value for R0, we draw values across a broad distribution of possible values and select those that lead to simulations compatible with the observed data. |
| Concentration, k | Uniform prior from 0.01 to 10 | Parameter that defines variability in the number of secondary infections per infection, i.e., a measure of “superspreading”. |
| Generation interval offset | Lognormal prior with median 7.02 days and interquartile range 6.45 to 7.64 | Time from infection to start of any infection potential (i.e., the latent period, which is also assumed to be the incubation period). |
| Generation interval shape | 1.5 | Fixed value of Weibull distribution that controls the shape of the generation interval distribution. |
| Generation interval scale | Uniform prior from 1.277 to 10.214 | Values of scale parameter for Weibull distribution; this prior corresponds to median generation interval of 8 days to 15 days, assuming that the incubation/ latent period is 7 days. |
| Recovery/mortality delay distribution | 9 days | Constant time lag between symptom onset and recovery or death. |
| Case fatality ratio | 0.619 | Probability that an infected person dies. |
- With highly effective surveillance, we assume the probability that an infection would be detected by community surveillance was 70%, and that the probability an infection would be detected through contact tracing was 95%. With less effective surveillance, we assume the community surveillance probability was 30% and the contact tracing probability was 50%.