What to know
- This dashboard's nonfatal overdose data come from CDC's Drug Overdose Surveillance and Epidemiology Syndromic Surveillance (DOSE-SYS) system.
- 47 states and the District of Columbia share syndromic surveillance data with DOSE-SYS.
- Emergency Department (ED) visits for suspected nonfatal drug overdose are reported to DOSE-SYS using electronic health record text queries from syndromic surveillance systems.

About the DOSE-SYS dashboard
See the Accessible version of this dashboard.
Data from the CDC’s Drug Overdose Surveillance and Epidemiology Syndromic Surveillance (DOSE-SYS) system uses electronic health record information reported though syndromic surveillance systems including the National Syndromic Surveillance Program (NSSP) BioSense Platform for the following 8 syndrome definitions:
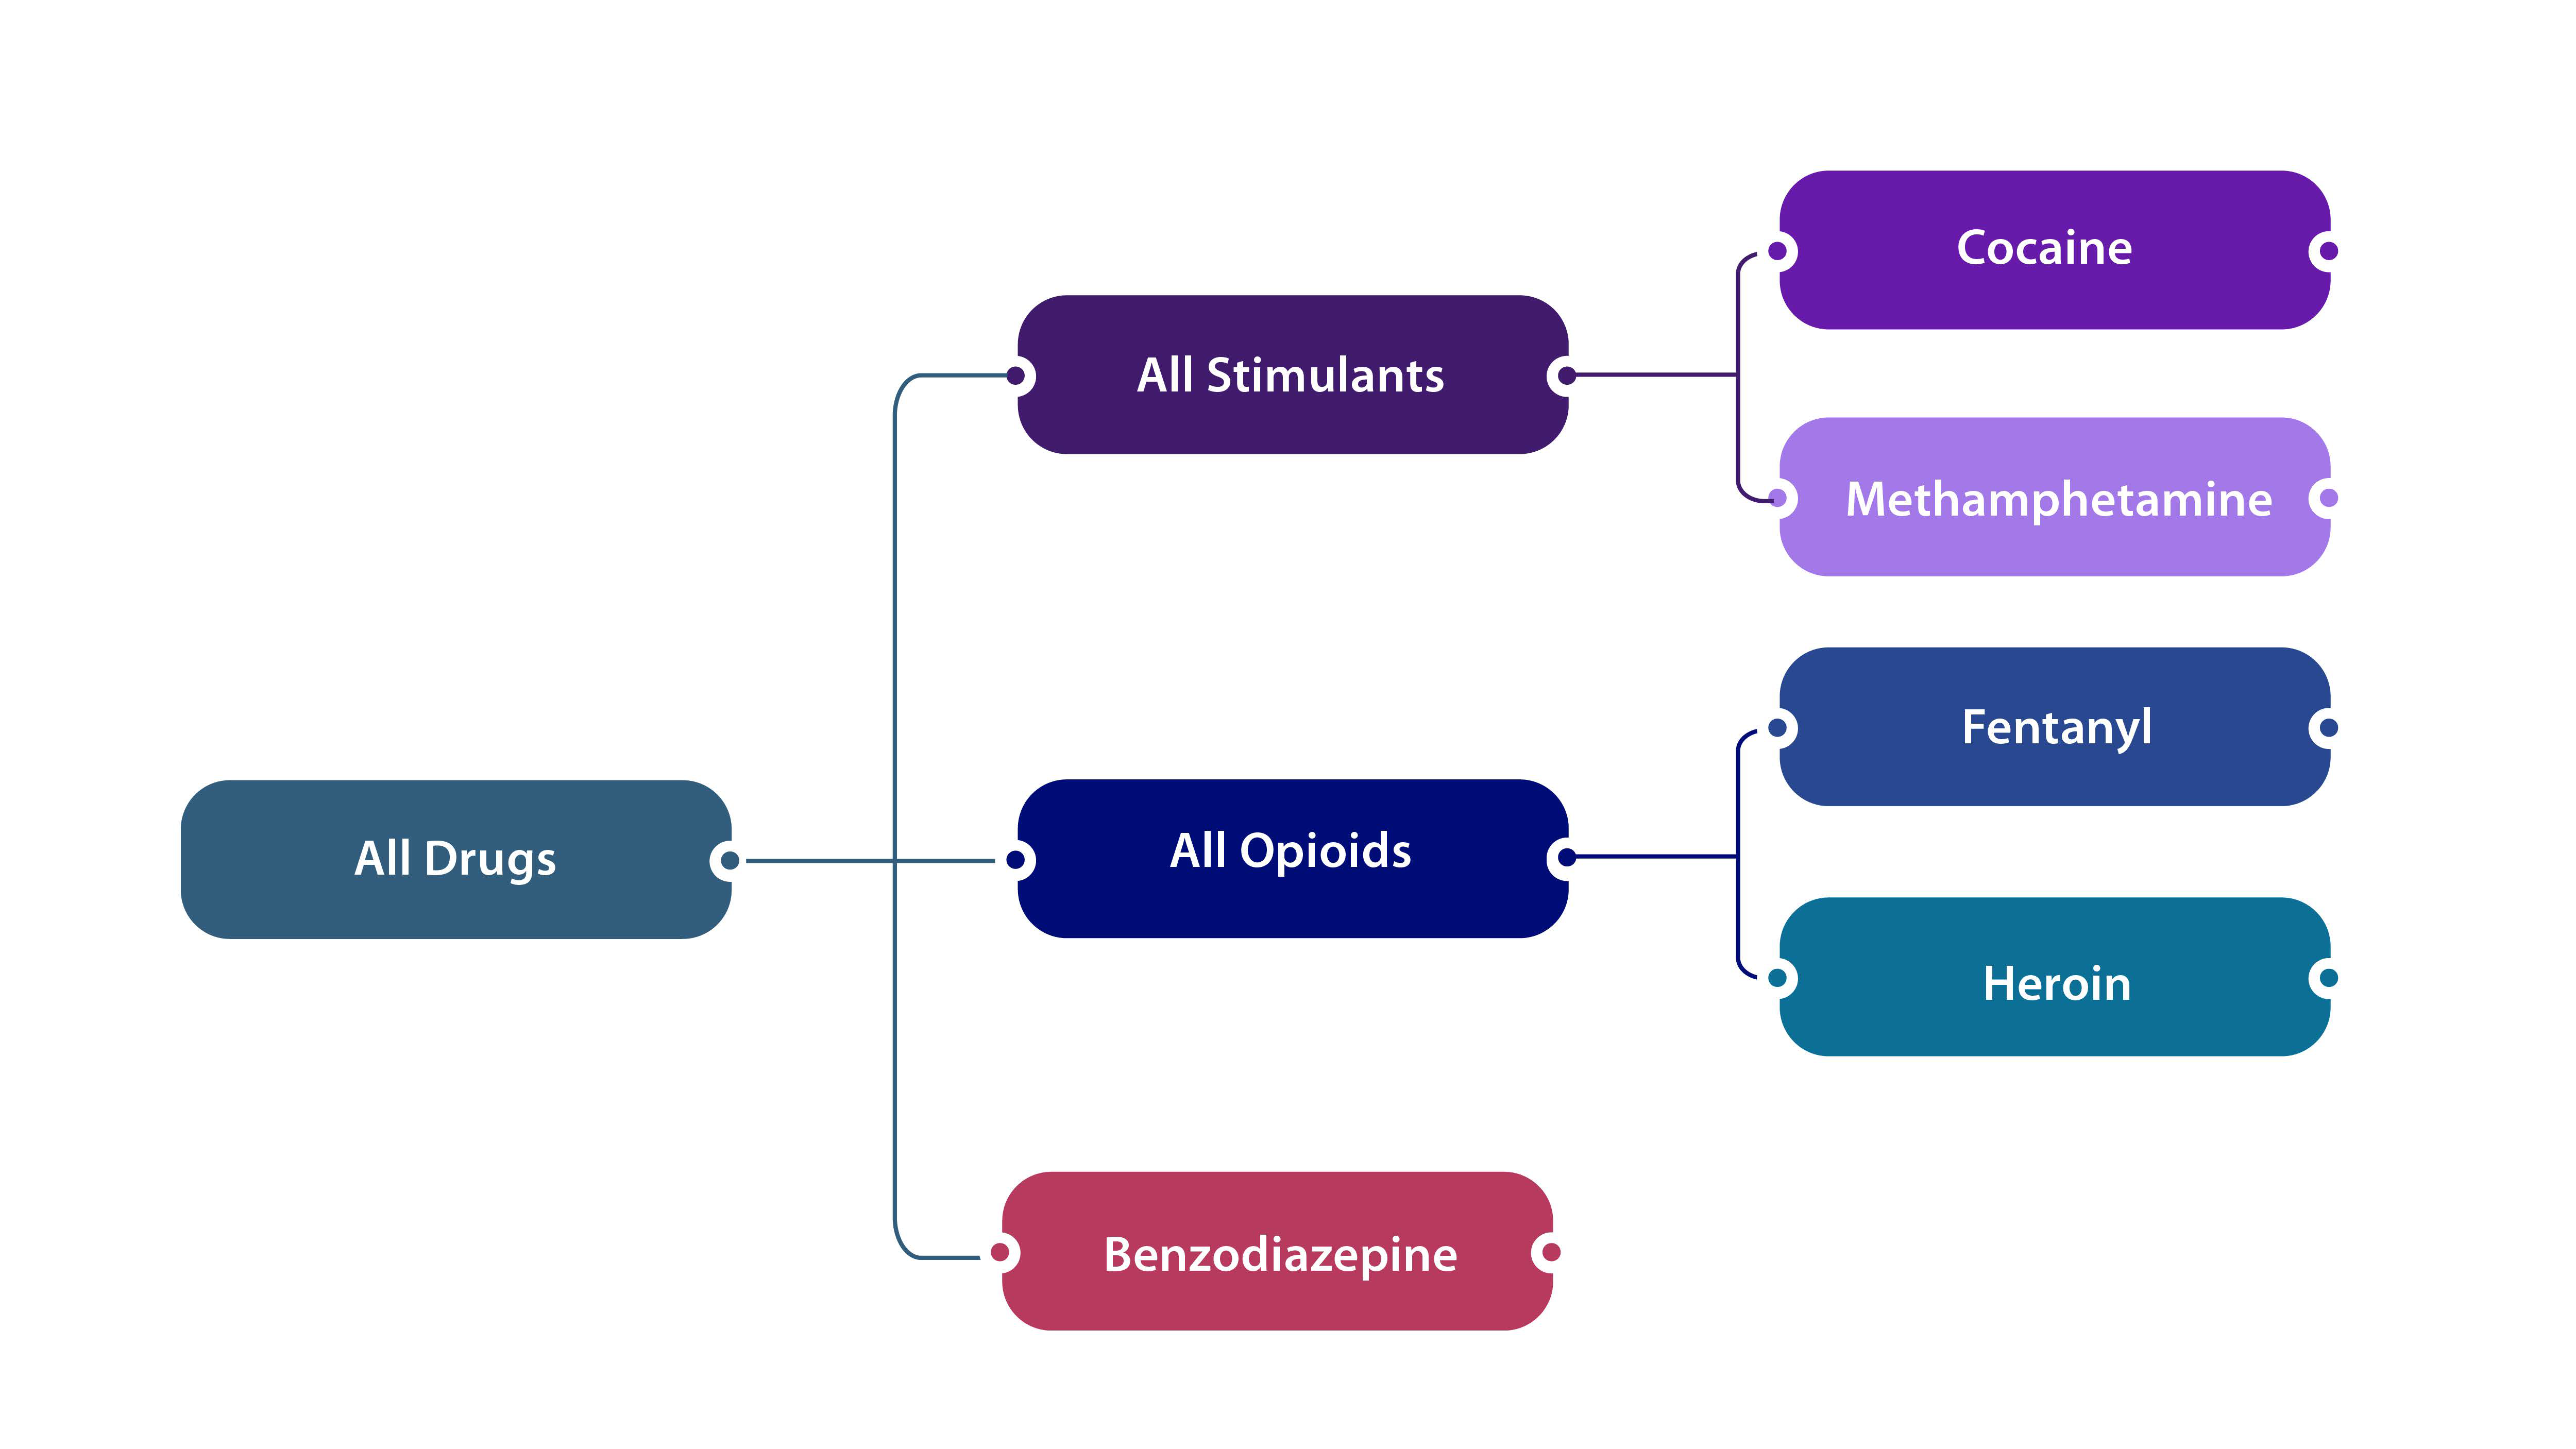
These syndrome definitions are not mutually exclusive but rather reflect nesting of drug categories depicted in this figure. Some suspected nonfatal overdose visits may involve multiple substances (e.g., a given overdose-related ED visit could have involved both opioids and stimulants). Total monthly or annual emergency department (ED) visits involving suspected nonfatal drug overdoses per 10,000 total ED visits are presented. The dashboard also includes demographic figures (age, sex, and race/ethnicity) for all participating jurisdictions combined. This dashboard represents the most up-to-date data1 from the CDC's DOSE-SYS system and is updated monthly. Key data considerations for interpretation are provided below the dashboard.
Read more about the DOSE System, including syndrome definitions and archived reports.
Syndromic surveillance uses data, commonly from ED visits, to detect trends and rapidly inform public health responses on various health outcomes, including suspected nonfatal drug overdose. These data may be used by state and local health departments to detect changes quickly and identify local drug overdose clusters. Notably, syndromic data may be collected before diagnosis or laboratory results are available. Race/ethnicity information is captured from electronic health record demographic fields and may be missing or incomplete. Syndromic surveillance data provide timely information to monitor suspected nonfatal drug overdose trends and are complementary to DOSE discharge data (DOSE-DIS).A
To learn more about the DOSE program, visit the DOSE System page. To learn more about nonfatal drug overdose trends identified in DOSE-DIS from ED and inpatient hospitalization visits, visit: DOSE-DIS Dashboard.
Suspected nonfatal overdose-related ED visits can be identified using diagnosis codes, specifically, International Classification of Diseases, Tenth Revision, Clinical Modification (ICD-10-CM) codes, International Classification of Diseases, Ninth Revision, Clinical Modification (ICD-9-CM) codes, and SNOMED CT (Systematized Nomenclature of Medicine — Clinical Terms) codes.
Where manner of injury is defined, only diagnosis codes for "unintentional" or "undetermined" intent drug poisoning are included in the DOSE standardized syndrome definitions (full definitions within links below). Other diagnosis codes specific to opioid drug use, abuse, or dependence, without intoxication, are less specific (e.g. F11.10: Opioid abuse, uncomplicated); therefore, additional information is needed to be captured as a suspected opioid-involved overdose.
These definitions also utilize free text "chief complaint", which represents the purpose of an ED visit. When based solely on chief complaint, records must include certain terms or a combination of terms. For example, for opioid overdoses without a mention of naloxone, a record must include two components: 1) text indicating an overdose or poisoning and 2) text indicating the involvement of an opioid or a diagnosis code for opioid use, abuse, or dependence without intoxication. Exclusions of chief complaint combinations may also apply.
Please click on each link below to see the current full suspected nonfatal syndrome definition along with context and description of the definition purposes:
- Make the selections below for each corresponding figure, including demographic figures that summarize suspected nonfatal drug overdose ED visits by age group, sex, and race/ethnicity:
- Select a drug syndrome: Click on a radio button to select from a drug syndrome.
- Select a jurisdiction: Click on the drop-down list to view suspected nonfatal drug overdose visit data by a specific jurisdiction or overall. Demographic figures, including race/ethnicity, are only available for all participating jurisdictions combined.
- Select annual or monthly data: Click on the radio button to select annual or monthly data.
- Select timeframe to display: Use the month and year drop down to select month of interest. If the annual option is selected, a 12-month rolling average ending at the selected time period will be displayed (e.g. February 2024-January 2025 will be shown if January 2025 is selected).
- In the time trend figure (line graph) below, the figures will display either: 1) time trends in multiple selected suspected nonfatal drug overdose types for all participating jurisdictions (i.e. 48 jurisdictions in most years), or 2) time trends in one selected suspected nonfatal drug overdose type for a selected jurisdiction compared to all participating jurisdictions.
- All visualizations will responsively adjust to your selections, including the summary data points; map; plots; and associated data tables. Use the RESET button to clear all selections. Most figures will default to show All Drug overdoses in the most recent month for all participating jurisdictions. The bar chart by drug indicator defaults to show every drug indicator except All Drug overdoses. The line graph defaults to show data from January 2023 to present.
- Data suppression rules will impact monthly and annual values. In cases where a monthly value is suppressed, any annual 12-month period that includes the suppressed month will also be suppressed. For example, data is suppressed during the early months of the COVID-19 pandemic (March 2020 through August 2020). Consequently, annual values will be suppressed for the 12-month period ending in March 2020 through the 12-month period ending in July 2021.
Suggested citation
Centers for Disease Control and Prevention. Nonfatal Drug Overdose Surveillance and Epidemiology Syndromic Surveillance (DOSE-SYS) System. Atlanta, GA: US Department of Health and Human Services, CDC; [INSERT YEAR, MONTH, DAY]. Access at: https://www.cdc.gov/overdose-prevention/data-research/facts-stats/dose-dashboard-nonfatal-surveillance-data.html
Related resources
- DOSE Home Page
- Drug Overdose Surveillance and Epidemiology (DOSE) System Fact Sheet
- DOSE-DIS Dashboard: Nonfatal Overdose Emergency Department and Inpatient Hospitalization Discharge Data
- The Fentalog Study: A Subset of Nonfatal Suspected Opioid Overdoses with Toxicology Testing
- SUDORS Dashboard: Fatal Overdose Data
- CDC's ESOOS Program
- MMWR Articles
- Journal Articles