Keys to Success with the SAAR
SAAR Overview
The Standardized Antimicrobial Administration Ratio (SAAR) provides a standardized metric of antimicrobial use. The SAAR is a ratio comparing observed, or reported, antimicrobial use to the antimicrobial use predicted by a referent, or baseline, population.

- A SAAR < 1.0 indicates antimicrobial use was less than predicted.
- A SAAR = 1.0 indicates antimicrobial use was equivalent to predicted use.
- A SAAR > 1.0 indicates antimicrobial use was greater than predicted.
A SAAR is not a definitive measure of appropriateness or judiciousness of antimicrobial use and any SAAR value may warrant additional investigation.
Remember: You can only calculate a SAAR when the number of predicted antimicrobial days are greater than one and the antimicrobial days do not exceed the days present.
SAAR p-value
The SAAR p-value is a statistical measure that indicates if reported antimicrobial use is statistically significantly different from predicted antimicrobial use.
- If the p-value ≤ 0.05, then the reported antimicrobial days are statistically significantly different from predicted antimicrobial days.
- If the p-value > 0.05, then the reported antimicrobial days are not statistically significantly different than the predicted antimicrobial days.
Due to the large number of days present reported each month, most SAAR p-values are less than 0.05 and users should interpret them with caution, as statistical significance does not necessarily translate to clinical significance.
95% Confidence Interval (CI)
The 95% CI is the range of values in which we have a high degree of confidence that the true SAAR value lies. However, the SAAR is the most likely value.
- If the 95% CI does not include 1.0 (for example: 95% CI = [0.85, 0.92]), the SAAR is statistically significantly different than 1.0 (specifically, the reported antimicrobial days are significantly different than the predicted antimicrobial days).
- If the 95% CI includes 1.0 (for example: 95% CI = [0.85, 1.24]), the SAAR is not statistically significantly different than 1.0 (specifically, the reported antimicrobial days are not significantly different than the predicted antimicrobial days).
The SAAR percentile is the percentile a SAAR falls into based on the distribution of location specific SAARs found in the NHSN AU Option Report Data Tables. SAARs were calculated for each SAAR location reporting nine or more months of data and percentiles are based on those location-year-level distributions. The 50th percentile is the median location-specific SAAR value. For example, a SAAR for a medical ICU location with a SAAR percentile of 90 indicates 89% of SAAR values reported from medical ICU locations are less than that SAAR and 10% of SAAR values reported from medical ICU locations are higher than it based on data reported into the AU Option.
SAAR Baselines
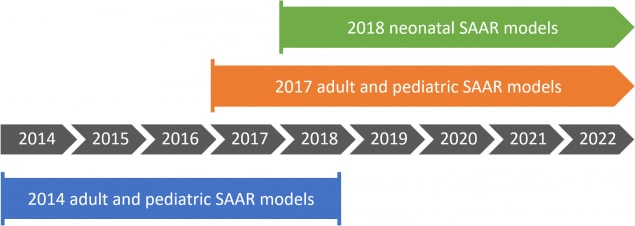
NHSN currently offers three SAAR baselines, each applicable to a select set of patient care locations and time periods. The table below provides a high-level overview of each baseline.
| SAAR Baseline | Locations | Antimicrobial Categories | Dates |
|---|---|---|---|
| 2014 baseline adult and pediatric SAARs* | 6 adult and pediatric intensive care units (ICUs) and wards | 5 antimicrobial categories | January 1, 2014 – December 31, 2018 |
| 2017 baseline adult and pediatric SAARs | 13 adult and pediatric medical, surgical, medical-surgical ICUs, wards, step down units, and oncology units | 15 antimicrobial categories | January 1, 2017 – present |
| 2018 baseline neonatal SAARs | 4 neonatal units, including step-down nurseries and neonatal critical care units | 7 antimicrobial categories | January 1, 2018 – present |
*You cannot directly compare SAARs calculated under the 2014 baseline with 2017 baseline SAAR values.

You can find reports based on each of the SAAR baselines in Analysis Reports, within the Antimicrobial Use and Resistance (AUR) Module folder.

Troubleshooting
Are you getting the “No Records Met Your Criteria” message when you try to generate a SAAR? Try these quick fixes below to get your SAAR reports up and running.
Generate data sets
Newly uploaded data aren’t available in analysis reports until you generate new data sets within NHSN. Be sure to check the “Timeboxing” and generate new data sets after uploading data into NHSN. See the Generating Datasets Guide [PDF – 500 KB] for more information.
Check your user rights
NHSN uses the Patient Safety Annual Facility Survey for risk adjustment in the SAARs. Without access to the survey data, you cannot view the SAAR data. Review and correct your user rights with your NHSN Facility Administrator and then generate new data sets. Refer to the guidance document that outlines minimum AU rights [PDF – 400 KB].
Check the location type
While NHSN encourages facilities to submit AU data from all NHSN-defined inpatient locations, facility-wide inpatient (FacWideIN), and select outpatient acute-care settings (specifically, Emergency Department, Pediatric Emergency Department and 24-hour Observation Area), you can only generate a SAAR for the specific locations included in each SAAR baseline. You can find a list of the locations you can generate 2017 or 2018 baseline SAARs for in Table 5 of the AUR Module Protocol [PDF – 1 MB]. In the future, as more facilities submit AU data, the NHSN Team hopes to develop SAARs for additional location types.
Email the NHSN Helpdesk
If you tried all the options above and still can’t generate a SAAR, please email the NHSN Helpdesk at nhsn@cdc.gov.
Additional Resources
- AUR Module website
- AUR Module Protocol [PDF – 1 MB]
- NHSN’s Guide to the SAAR [PDF – 2 MB]
- Patient Safety Analysis Quick Reference Guides
- SAAR Quick Learn Series Part One [PDF – 1 MB]
- SAAR Quick Learn Series Part Two [PDF – 2 MB]
- Antimicrobial Use Option Reports
- 2017/2018 Baseline SAAR Details [PDF – 568 KB]
- 2014 Baseline SAAR Details [PDF – 100 KB]
- Strategies to Assess Antibiotic Use to Drive Improvements in Hospitals [PDF – 500 KB]