What to know
- CFA provides insights to support public health planning and response for the fall and winter respiratory virus season.
- Our current and upcoming products related to respiratory virus season include epidemic trend estimates (Rt), season outlooks, outbreak simulators, ensemble forecasts, and other data channels.
Current Epidemic Trends
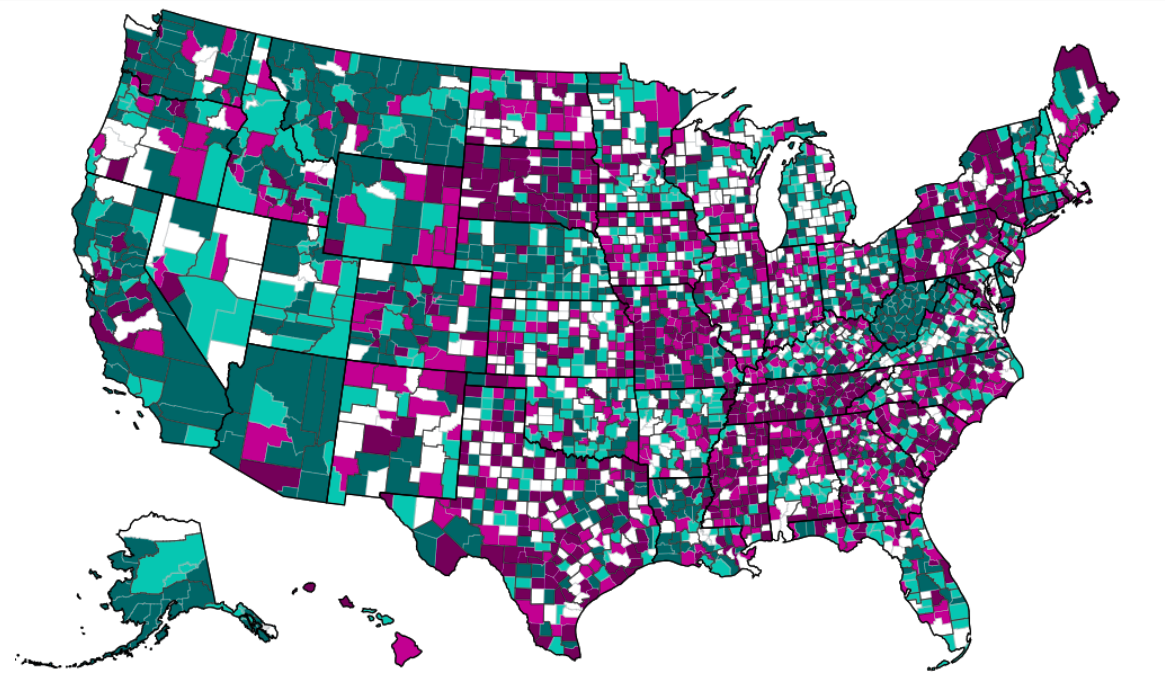
CFA provides weekly estimates of epidemic trends based on Rt, the time-varying reproductive number, at the national, state, and health service area (HSA) levels. Rt is a data-driven measure of disease transmission that can tell us whether infections are growing, declining, or staying the same, which can help public health practitioners prepare and respond. Estimates are seasonally available for COVID-19, influenza, and RSV. Read more about how we estimate Rt and how to interpret it.
Respiratory Disease Season Outlook
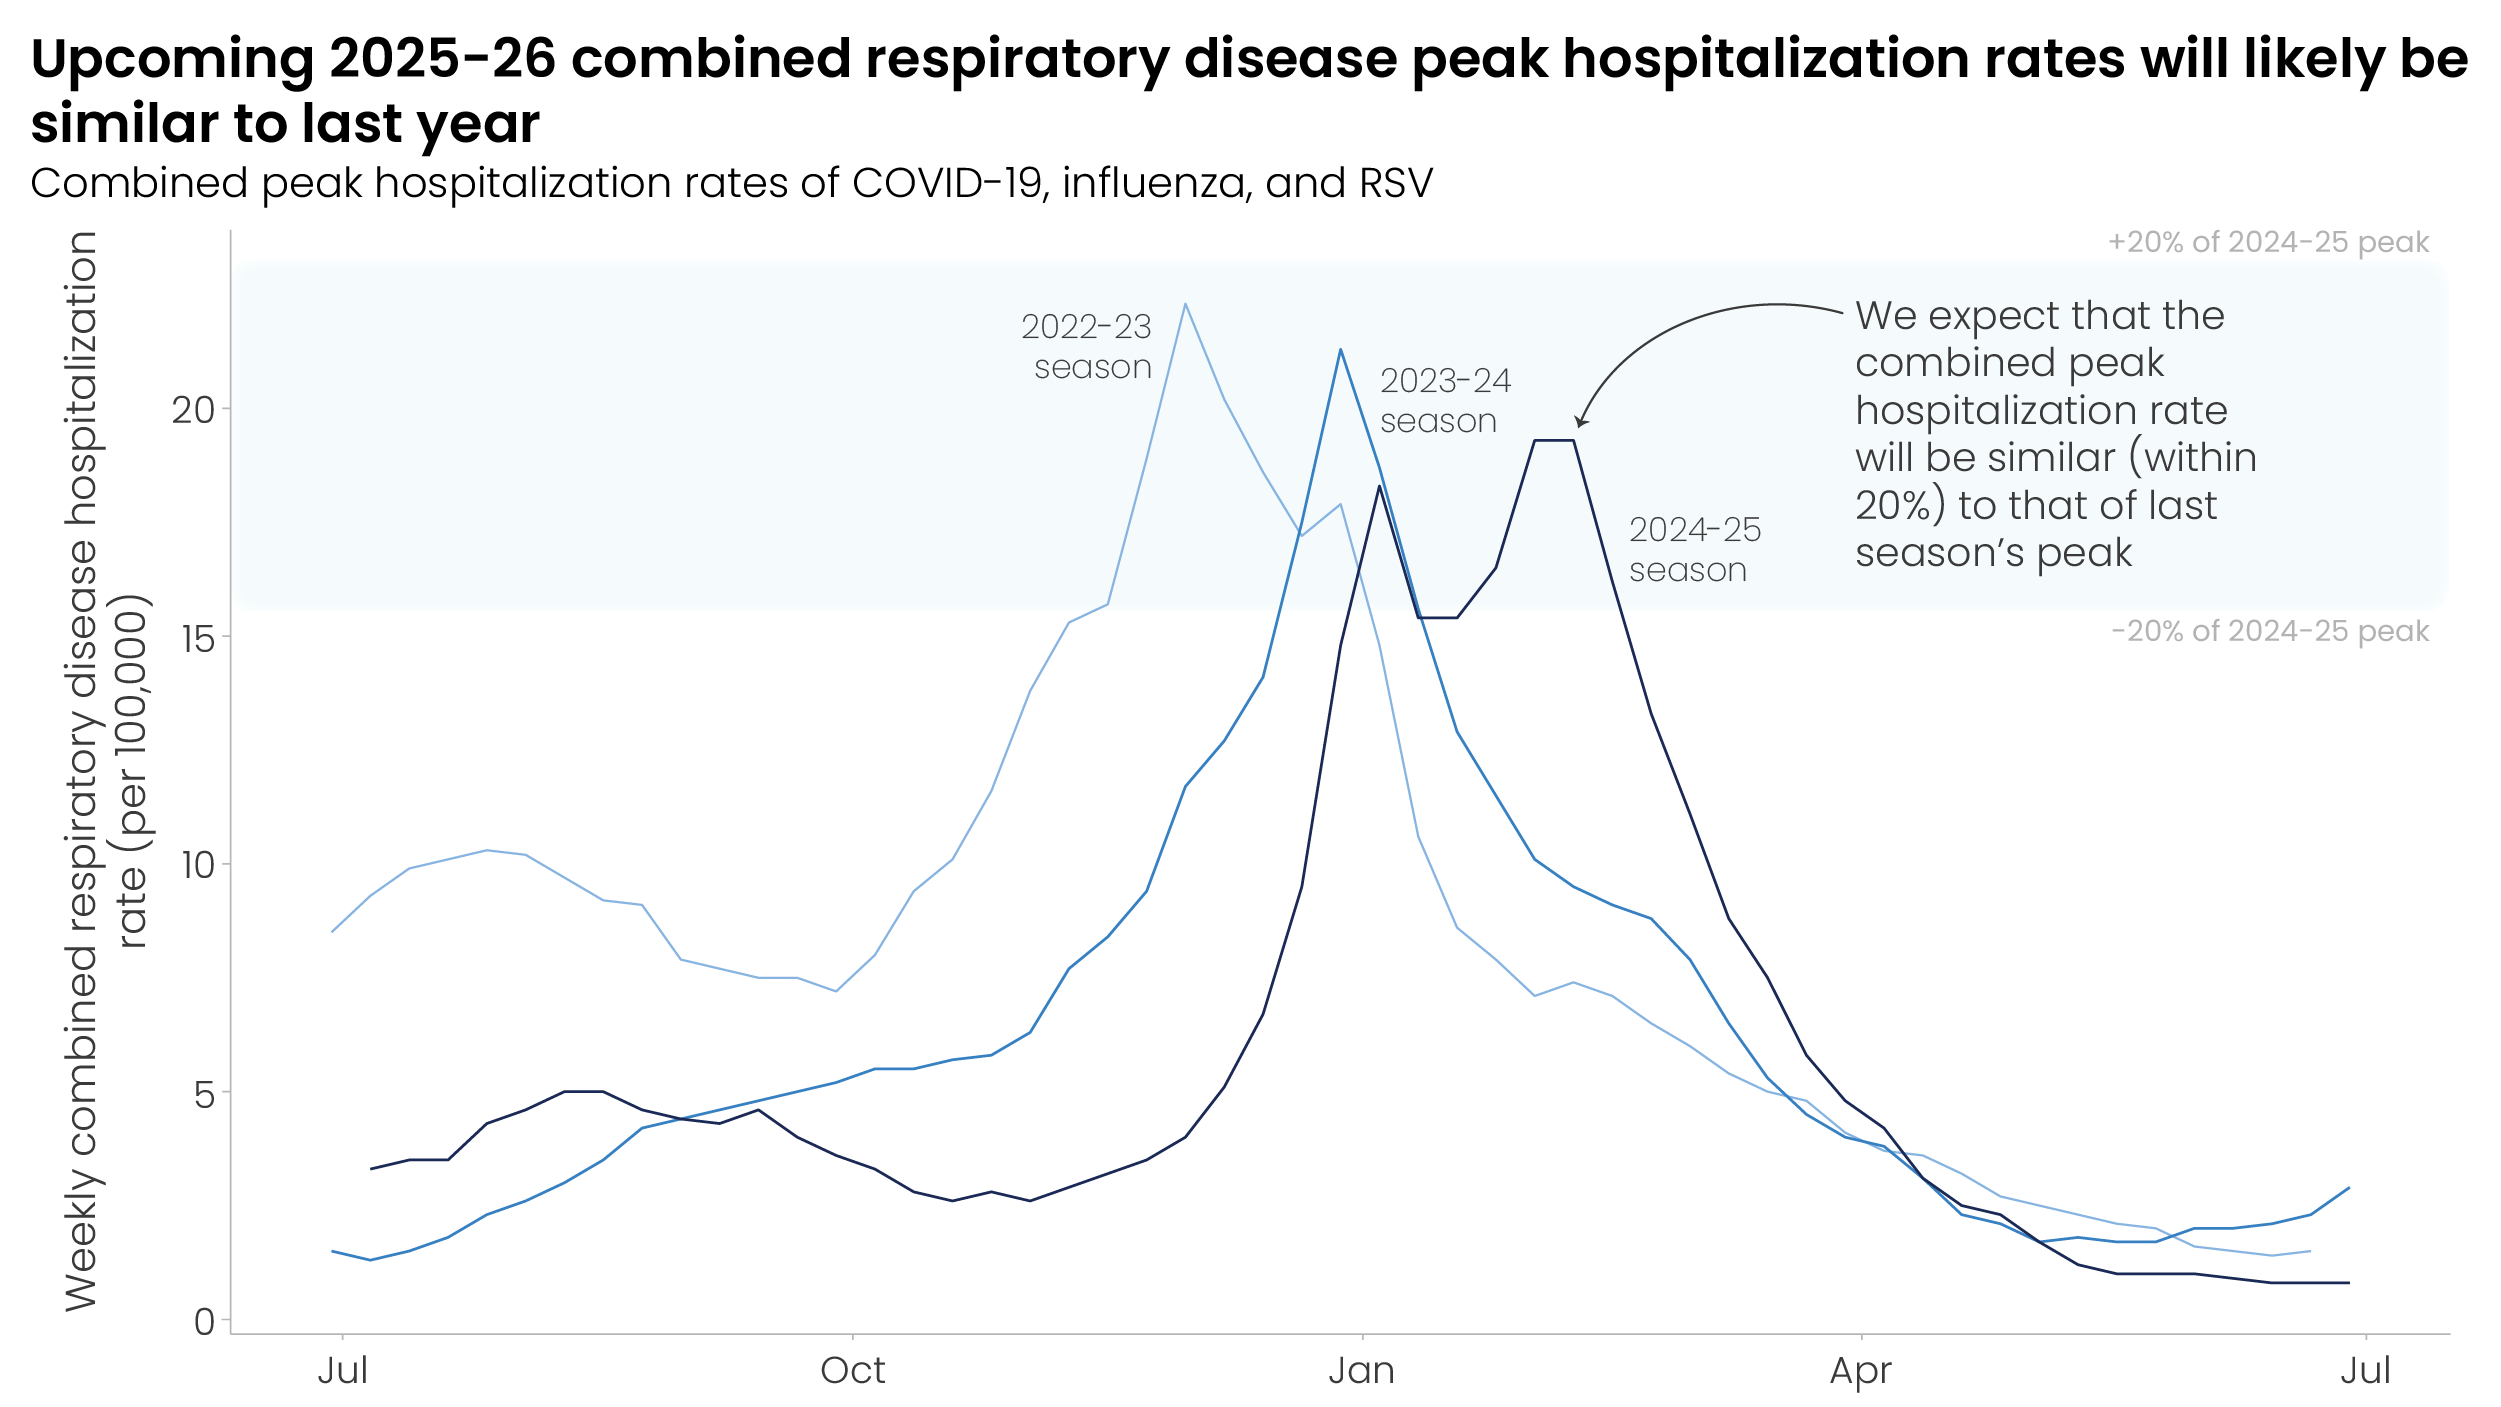
CFA leads development of the annual CDC respiratory disease season outlook to provide decision-makers information for public health preparedness, such as planning for potential surges in hospital demand. CDC expects the 2025-2026 fall and winter respiratory disease season will likely have a similar number of combined peak hospitalizations due to COVID-19, influenza, and RSV compared to last season. See the 2025-2026 outlook for more information about forecasted impact and peak timing for each disease. CDC will continue to monitor respiratory disease activity throughout the fall and winter as warranted by changes in the trajectories of any of the three diseases.
How scenario modeling can inform decision-making
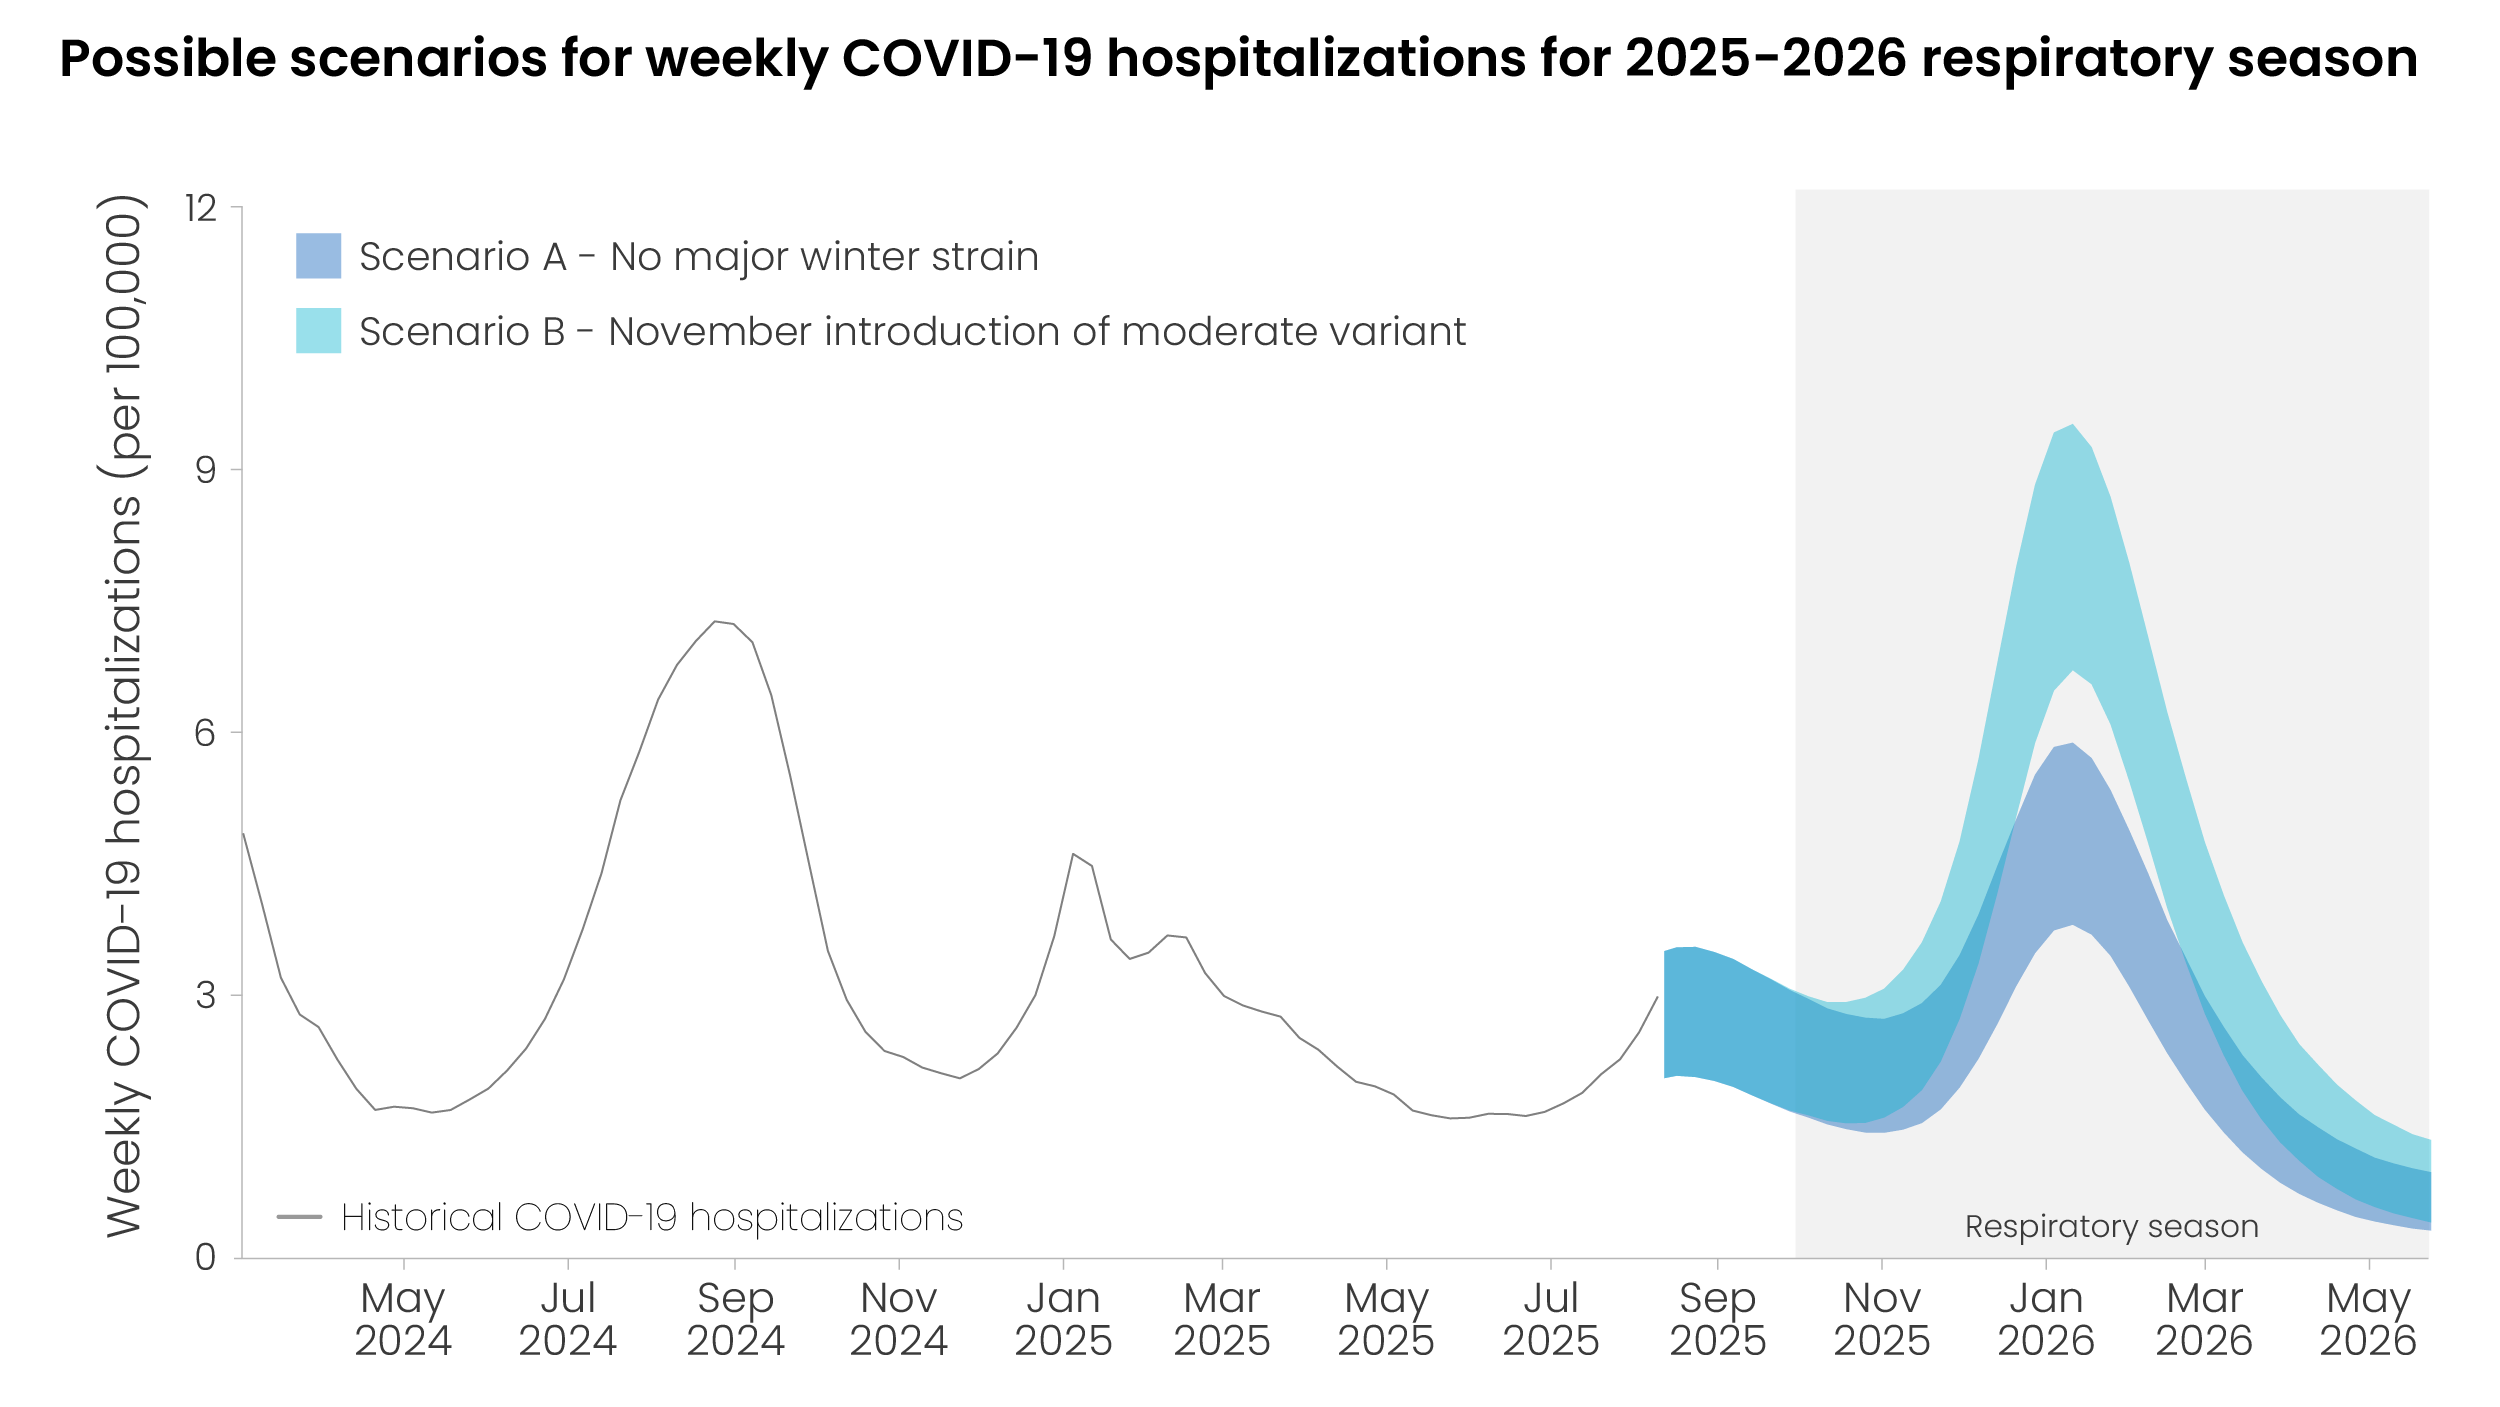
CFA has developed scenario modeling capability that allows decision-makers to examine a range of possible outcomes under different assumptions about the future, providing insights for addressing specific policy questions and for general preparedness and planning. CFA's Behind the Model explainer series unpacks how CFA uses scenario modeling in Respiratory Disease Season Outlooks.
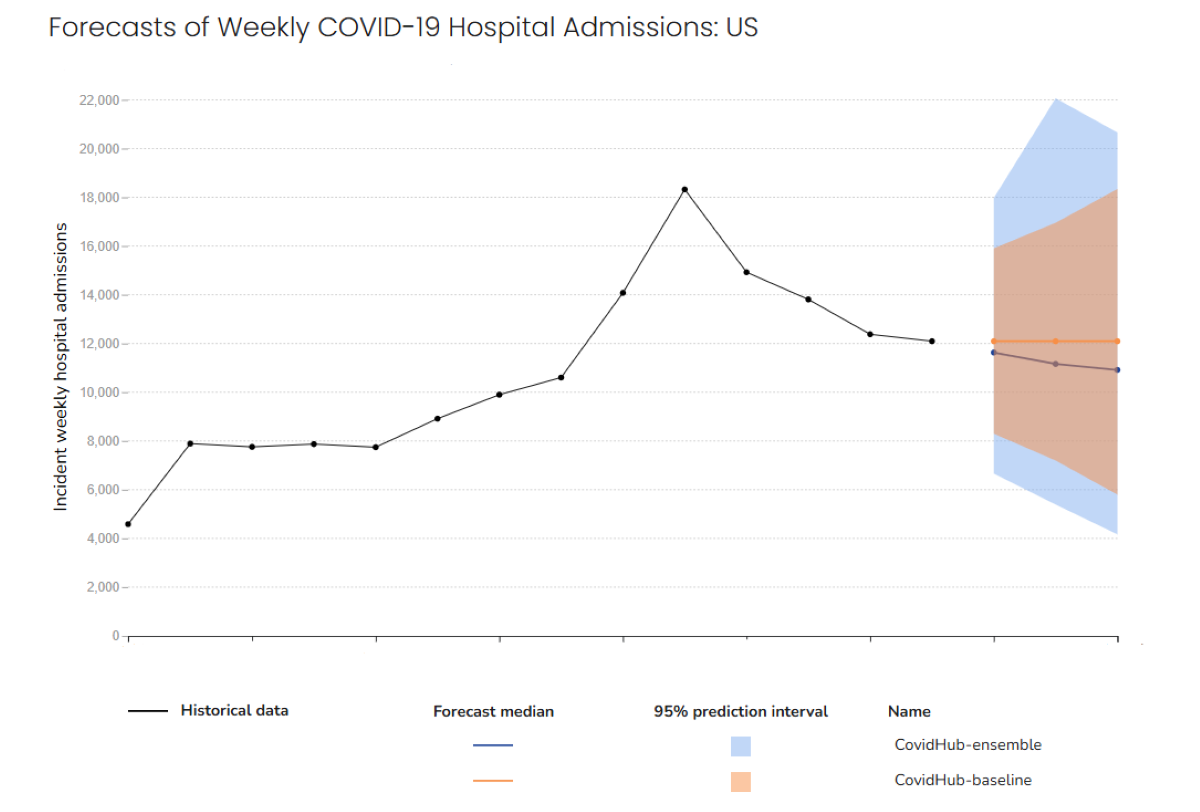
COVID-19 and RSV Ensemble Forecasts
CFA coordinates the COVID-19 Forecast Hub and the RSV Forecast Hub. Both hubs receive forecasts from modeling teams from across the country and build ensemble forecasts for emergency department visits and for hospital admissions due to COVID-19 or RSV. These ensemble forecasts help public health decision-makers anticipate healthcare burden and prepare for potential COVID-19 or RSV surges.
Respiratory Illnesses Data Channel
CFA provides forecasts and analytics to support CDC's wider efforts to prepare for the annual respiratory virus season. This includes contributing to the Respiratory Illnesses Data Channel, which provides a snapshot of COVID-19, influenza, and RSV activity in communities across the country. The channel offers critical information about current virus activity levels, wastewater testing, emergency department visits, epidemic trends (CFA's Rt estimates), and test positivity rates. With a clearer picture of what is happening, public health leaders and individuals can make informed decisions to keep themselves and those around them safe.