75 Years of Mortality in the United States, 1935–2010
- Key findings
- Although the number of deaths increased over the 75 years, the risk of dying decreased.
- Heart disease and cancer remained the 1st and 2nd leading causes of death, respectively, over the 75-year period.
- The decrease in death rates over the 75 years varied by age.
- The male and female gap in death rates peaked in 1975–1981 and has narrowed since then.
- The gap in death rates by race was widest between 1988 and 1996.
- Summary
- Definitions
- Data source and methods
- About the author
- References
- Suggested citation
NCHS Data Brief No. 88, March 2012
PDF Version (737 KB)
Donna L. Hoyert, Ph.D.
Key findings
- Although single year improvements in mortality were often small, the age-adjusted risk of dying dropped 60 percent from 1935 to 2010.
- Heart disease, cancer, and stroke were among the five leading causes every year between 1935 and 2010.
- The risk of dying decreased for all age groups but was greater for younger age groups with a 94 percent reduction in death rates at 1–4 years compared with a 38 percent decline at 85 years or more.
- Age-adjusted death rates were consistently greater for males than females (for example, 65 percent higher than those for females between 1975 and 1981 compared with 40 percent higher in 2010) as each decreased substantially between 1935 and 2010.
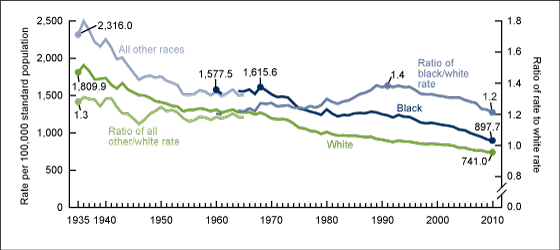
- The risk of dying decreased for all race subgroups of the U.S. population from 1935 to 2010; however, differences persisted between groups (the gap was the widest between 1988 and 1996).
Reductions in deaths and death rates are often used as an indicator of the success of public health initiatives to improve the health and well-being of the U.S. population, as well as to set national goals for reducing disparities in the burden of mortality across groups. Anti-tobacco campaigns, AIDS prevention programs, and cancer screening promotions all use lives saved as a measure of success. About 80 of the Healthy People 2020 objectives are about death (1). Since mortality statistics do not change markedly from year to year, one might not appreciate the progress in reducing mortality when looking at short-term change. This report uses data from the National Vital Statistics System (NVSS) over a 75-year period, including preliminary data for 2010, to examine long-term trends in mortality in the United States by age, sex, and race.
Keywords: death, death rate, leading cause of death, National Vital Statistics System
Although the number of deaths increased over the 75 years, the risk of dying decreased.
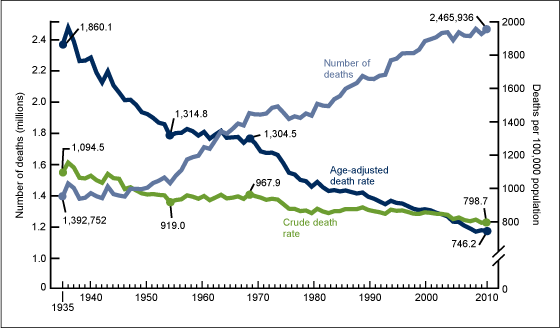
Figure 1. Number of deaths, crude and age-adjusted death rates: United States, 1935–2010
NOTES: 2010 data are preliminary. Crude death rates on an annual basis are per 100,000 population; age-adjusted rates are per 100,000 U.S. standard population. Rates for 2001–2009 are revised and may differ from rates previously published.
SOURCE: CDC/NCHS, National Vital Statistics System, Mortality.
While the total number of deaths increased by 1.1 million between 1935 and 2010, the risk of dying decreased. The crude death rate fell 27 percent from 1,094.5 to 798.7 deaths per 100,000 population between 1935 and 2010. The improvement in the risk of dying was actually larger than 27 percent because the U.S. population was getting older over this time period. When the effect of the aging of the population is removed by calculating an age-adjusted death rate to examine the risk if the population age distribution was like that in 2000 for all years, the risk of dying decreased by 60 percent from 1935 to 2010.
Although there were year to year exceptions, the last 75 years witnessed sustained declines in the risk of dying in the United States. As seen in (Figure 1), the age-adjusted death rate declined 29 percent from 1935 to 1954, slowed to 2 percent from 1955 to 1968, and decreased 41 percent between 1969 and 2010.
Heart disease and cancer remained the 1st and 2nd leading causes of death, respectively, over the 75-year period.
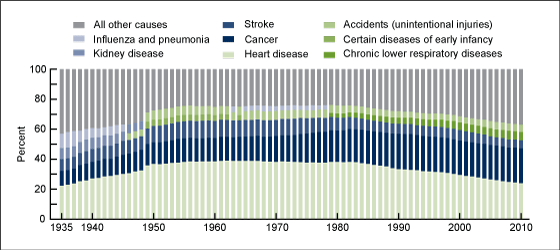
Figure 2. Percentage of all deaths due to five leading causes of death by year: United States, 1935–2010
NOTE: 2010 data are preliminary.
SOURCE: CDC/NCHS, National Vital Statistics System, Mortality.
A 75-year perspective points to both stability and change in the leading causes of death: stability because three causes (heart disease, cancer, and stroke) remained among the five leading causes each year between 1935 and 2010; and change because other causes moved into or dropped out of the five leading causes at different points over the past 75 years (Figure 2). There were also changes in the proportion of all deaths that were due to each of the leading causes. For example, heart disease and cancer were the leading causes of death from 1935 to 2010, but it was in 1983 that these two conditions accounted for the highest percent (60 percent) of all deaths. In 2010, they constituted 47 percent of all deaths.
Other conditions have all occupied spots within the five leading causes for some but not all years between 1935 and 2010. Specifically, chronic lower respiratory diseases entered the five leading causes of death in 1979; certain diseases of early infancy was among the five leading causes only from 1949 to 1962 and 1964; accidents entered the five leading causes of death in 1946; kidney disease was among the five leading causes only from 1935 to 1948; and influenza and pneumonia was among the five leading causes between 1935 and 1945, again in 1963, and between 1965 and 1978.
The decrease in death rates over the 75 years varied by age.
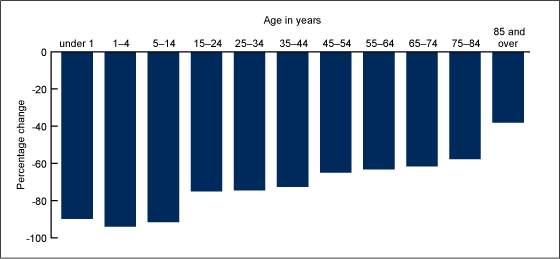
Figure 3. Percentage change in death rates by age: United States, 1935–2010
NOTE: 2010 data are preliminary.
SOURCE: CDC/NCHS, National Vital Statistics System, Mortality.
For all but the oldest age group (85 years and over), mortality risk fell more than 50 percent between 1935 and 2010 (Figure 3). The greatest reduction was among persons 1–4 years of age where the death rate declined from 440.9 to 26.6 deaths per 100,000 population, a decrease of 94 percent. Declining death rates were seen among the over 65 population, although not of the same magnitude as among the younger ages. For example, for persons 65–74 years of age, death rates declined by 62 percent, while death rates decreased by 58 percent for those 75–84 years of age, and declined 38 percent for persons 85 years or more.
The male and female gap in death rates peaked in 1975–1981 and has narrowed since then.
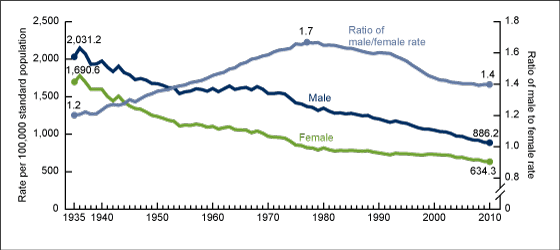
Figure 4. Age-adjusted death rates and ratio of rates by sex: United States, 1935–2010
NOTES: 2010 data are preliminary. Age-adjusted rates are per 100,000 U.S. standard population. Rates for 2001–2009 are revised and may differ from rates previously published.
SOURCE: CDC/NCHS, National Vital Statistics System, Mortality.
Between 1935 and 2010, age-adjusted death rates decreased by 56 percent for males and 62 percent for females (Figure 4). Female age-adjusted death rates declined from 1,690.6 in 1935 to 634.3 per 100,000 in 2010 while the age-adjusted death rate for males fell from 2,031.2 to 886.2 deaths per 100,000 population. Although males had consistently higher age-adjusted death rates than females throughout the 75 years, the ratio of male to female rates has fluctuated. For example, in 1935, the male to female death ratio was 1.2, rising to 1.7 in 1975–1981, and falling to 1.4 in 2000–2010.
The gap in death rates by race was widest between 1988 and 1996.
Figure 5. Age-adjusted death rates and ratio of rates by race: United States, 1935–2010
NOTE: 2010 data are preliminary. Age-adjusted rates are per 100,000 U.S. standard population. Rates for 2001–2009 are revised and may differ from rates previously published.
SOURCE: CDC/NCHS, National Vital Statistics System, Mortality.
Between 1935 and 2010, age-adjusted death rates decreased by 59 percent for the white population (Figure 5). Death rates for the black population were first reported in 1960. Prior to that, rates were reported for “all other races.” Since the black population made up 96 percent of those of all other races prior to 1960, it is possible to approximate the trend for the black population from 1935. Using this approximation, age-adjusted death rates decreased by 61 percent for the black population (35 percent for the all other races group between 1935 and 1959 and 43 percent for the black population between 1960 and 2010). Although the white population had consistently lower age-adjusted death rates than the all other races and the black populations throughout the 75 years, the ratio of the age-adjusted death rates fluctuated somewhat. For example, the all other races to white population death ratio was about 1.3 between 1935 and 1942 and 1.2 between 1943 and 1959. The ratio of black to white population death ratio was 1.2 in 1960, rose to 1.4 between 1988 and 1996, and then declined to 1.2 where it has remained since 2008.
Summary
While the overall risk of mortality decreased 60 percent over this 75-year period, there were fluctuations in the rate of decline most likely associated with changes in the broader environment. For example, the 29 percent decline in age-adjusted mortality in the earlier period from 1935 to 1954 was probably influenced by the introduction of various drugs such as antibiotics (2). In contrast, in the period 1955 to 1968, age-adjusted death rates decreased by only 2 percent, influenced in part by increases in diseases linked to tobacco use such as cancer and chronic lower respiratory diseases (3,4). In the most recent period from 1969 to 2010, significant progress in the prevention, diagnosis, and treatment of cardiovascular diseases (5) likely contributed to the 41 percent decline in age-adjusted mortality despite cancer continuing to increase from 1969 to 1990 and chronic lower respiratory diseases continuing to increase from 1969 to 1998.
Because year-to-year changes in death rates are often small, one might not appreciate the full extent of progress in reducing mortality in the United States over the past ¾ of a century. For example, the 2010 age-adjusted death rate of 746.2 deaths per 100,000 population was just 0.5 percent lower than in 2009. However, the 2010 rate represented a 60 percent decrease from the 1935 age-adjusted death rate of 1,860.1 deaths per 100,000 population signaling significant progress in reducing the overall risk of death in the United States across all groups.
Definitions
Death rate: Total deaths per 100,000 population for a specified period. This rate represents the average chance of dying during a specified period for persons in the entire population. Age-adjusted death rates are useful when comparing different groups or over time because they remove the potential bias that can occur when the populations being compared have different age structures. NCHS uses the “direct” method of standardization using the projected year 2000 population. See the “Technical Notes” of “Deaths: Final Data for 2008” (6) for more detail.
Leading causes of death: Causes of death are sorted into rank order according to the number of deaths beginning with the largest number. See the “Technical Notes” of “Deaths: Final Data for 2008” (6) for more detail.
Data source and methods
Data presented in this report were based on information from death certificates filed in states and the District of Columbia and subsequently compiled into national data, also known as the National Vital Statistics System, by the National Center for Health Statistics (NCHS) for years 1935–2010. The data for 2010 are preliminary (7). With respect to race, the population subgroups for which statistics were available expanded over time; however, there are known reporting issues for some subgroups. This report shows data for white, all other races, and black populations that are available for long spans of time and are of good quality. Rates for 2001–2009 are revised to reflect updated intercensal population estimates; the rates may differ from rates previously published (7). See the “Technical Notes” of “Deaths: Final Data for 2008” (6) for more discussion of the data.
About the author
Donna L. Hoyert is a health scientist at the Centers for Disease Control and Prevention’s NCHS, Division of Vital Statistics, Mortality Statistics Branch.
References
- U.S. Department of Health and Human Services. Healthy People 2020. Accessed on January 5, 2012.
- Moriyama IM. The change in mortality trend in the United States. National Center for Health Statistics. Vital and Health Stat 3(1). 1964.
- Shopland DR. Tobacco use and its contribution to early cancer mortality with a special emphasis on cigarette smoking. Environ health Perspect 103(Suppl 8): 131–42. 1995.
- Akinbami LJ. Chronic obstructive pulmonary disease among adults aged 18 and over in the United States, 1998–2009. NCHS data brief, no 63. Hyattsville, MD: National Center for Health Statistics. 2011.
- Ford ES, Capewell S. Proportion of the decline in cardiovascular mortality disease due to prevention versus treatment: Public health versus clinical care. Annu Rev Public Health 32: 5–22. 2011.
- Minino A, Murphy SL , Xu JQ, Kochanek KD. Deaths: Final data for 2008. National Vital Statistics Report; vol 59 no. 10. Hyattsville, MD: National Center for Health Statistics. 2011.
- Murphy SL, Xu J, Kochanek KD. Deaths: Preliminary data for 2010. National Vital Statistics Report; vol 60 no. 4. Hyattsville, MD: National Center for Health Statistics. 2012.
Suggested citation
Hoyert DL. 75 years of mortality in the United States, 1935–2010 NCHS data brief, no 88. Hyattsville, MD: National Center for Health Statistics. 2012.
Copyright information
All material appearing in this report is in the public domain and may be reproduced or copied without permission; citation as to source, however, is appreciated.
National Center for Health Statistics
Edward J. Sondik, Ph.D., Director
Jennifer H. Madans, Ph.D., Associate Director for Science
Division of Vital Statistics
Charles J. Rothwell, M.S., Director
