Purpose
The Rate Stabilizing Tool (RST) is an ArcGIS-based tool that allows users to input their own record-level data to generate reliable, local-level age-standardized measures of chronic disease (e.g., prevalence, incidence, and mortality) or other population health outcomes. The goal of this instruction is to help you generate simulated point level data with your aggregate crude death rate.
Check and prepare your data.
1. To simulate individual death cases on the map, you will need either a count of death cases per geographic unit or a crude rate without age-adjustment or smoothing by age categories. Please make sure your outcome variables are integrated into county level or tract level. Request the numbers for 'insufficient data' units, if possible.
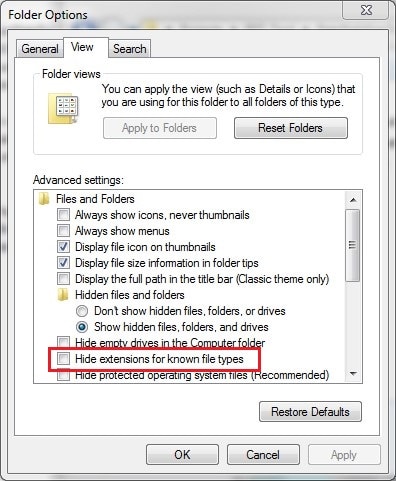
2. If your rate or count data file is in text or csv format, make sure to include a schema.ini file to specify each field type for join operation. You can skip step 2 and 3 if your data is in a .dbf, .shp, or geodatabase file. To create a schema file, you need to direct yourself to the folder your data file(s) locate. Create a new text file and rename it to schema.ini. If you create it successfully, you will see an icon of a cog over a sheet of paper. In case your schema.ini file icon still looks like a plain text file, go to START > Control Panel > Folder Options > View tab. Under Advanced settings section, uncheck Hide extensions for known file types option.
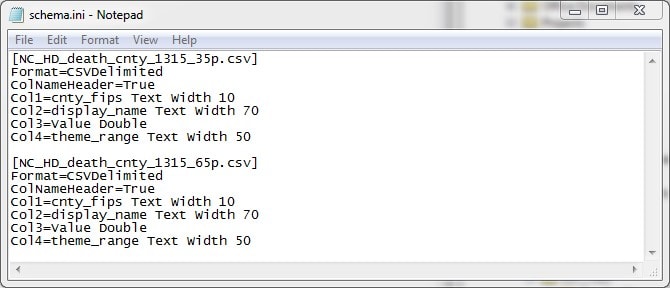
3. Open your newly created schema.ini file and try to locate if your file name is already in the list. Wrap your target file name with extension in bracket. Specify the table format; eligible format for tabular data in text file can be delimited by tab, comma, or any other custom character. Specify the field type for key fields next. You want to make sure the unique census ID is set as text field. A sample schema file for CDC interactive atlas data will look like the image displayed below. A schema.ini file can work for multiple data in the same folder.
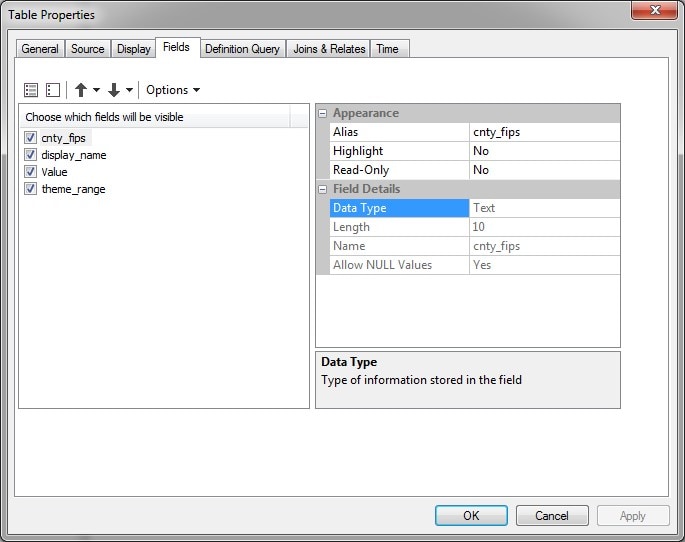
4. Add data to your new ArcMap project to check if the field is correctly specified. To check the field type, right click on data layer and click Properties. Under Fields tab, click on each field to see if Data Type on the right panel is correct.
Simulate data.
Please check your data file to see what types of outcome data you have. Go to section A if you have rates data by census unit and go to section B if you have counts data.
A) Simulate rate data.
To simulate rate data, you need to first convert the rate data into counts data. This whole section A is the instruction of how to convert rate data into counts. We will recommend you request for death counts, if possible, because you can skip the whole section here.
i. Download raw data and generate population breakdown for geographic unit.
- With the help of RST tool step 1, you can download raw data that includes detail population breakdown for counties or census tracts. Your downloaded raw data can also be used in the future steps of RST to generate an age-adjusted or Bayesian smoothed rate. Please reference the user manual for instructions about data download.
- If you don't have a county or census tract-level shapefile, you can download it from census TIGER/LINE for your state. You can find the official TIGER/LINE download from this link: https://www.census.gov/cgi-bin/geo/shapefiles/index.php. Extract the downloaded .zip file to your data folder.
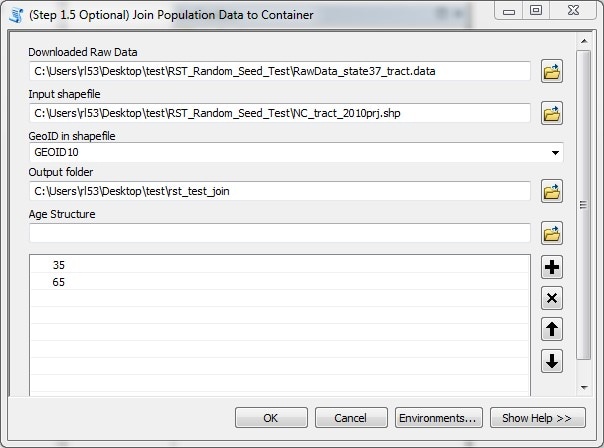
- Add RateStabilizerTool.tbx to your ArcToolbox, or direct yourself to the toolbox via Catalog. Double click on (Step 1.5 Optional) Join Population Data to Container to open the python script tool.
- Select downloaded raw data from step 1, the raw data name will look like RawData_stateXX_XXXX with the suffix of .data. Fill Input shapefile with your own census geography or TIGER file you just downloaded and specify the common ID that you are going to use to join population data with shapes (it's GEOID in most cases). Note: ensure that the geographic level of your raw data and your boundary data are the same, for example, tracts vs tracts, or counties vs counties. Set Output folder and then enter the lower boundaries of your age categories based on your available data. For example, if you have death rate for 35+ and 65+, you can set your age categories as 35 and 65. And then click OK.
- Click Add Data to add the newly created data file into the workspace. The newly created file will be named as your_original_shp_name_pop.shp.
ii. Join rate data to population breakdown and convert to count.
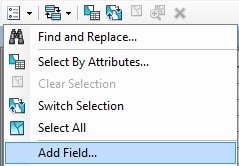
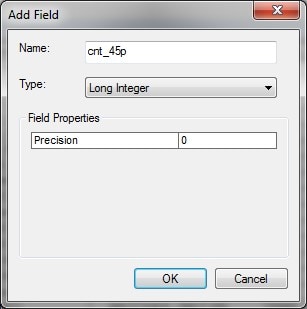
- First, you need to preset a new field for EACH age category to calculate the death case count. Click on Table Options and then select Add Field.... In the pop-up window, Name the new field and set the data Type as Long Integer and click OK. Please start your field name with a letter instead of numbers or special characters. Repeat this step until you have all age category created as a single field. In the sample test case, the new field name will be cnt_35p and cnt_65p.
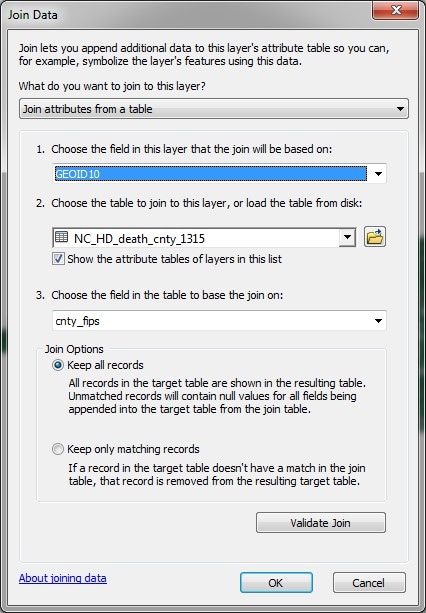
2. If you have wide format data, join the data directly to the population breakdown shapefile by using GEOID. Right click on your shapefile, under Joins and Relates, click Join.... In the pop-up window, select the GEOID field (the actual name may differ slightly) for both parts of the join. Select Keep all records and Validate Join. Click OK if validation is successful. Then skip to step 5.
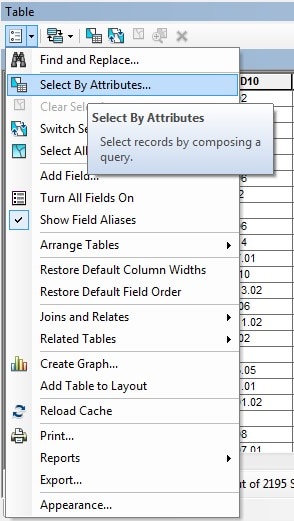
3. If your data is in long format, you will need to split the data file by its age category. Right click on your data file to Open attribute table. Click Table Options and Select by Attributes.
In the pop-up window, single click on your age field and then click on Get Unique Value.
Double click on your age field, and then click =, and then double click on the first age value. The selection query window will have an equation that looks like this in the image. And Click Apply.
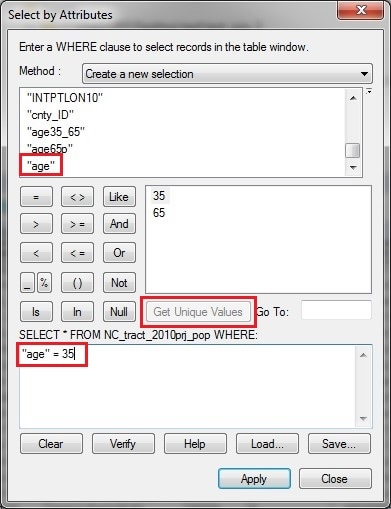
Now you've selected all counts that stand for 35 years and older in the example. Right click on the data layer, under Data section, and click on Export.... Make sure you marked the output filename with the age group you selected.
Repeat this step for every age group. You will have multiple data files now, each data file stands for a count for each census unit for each age group. Now you have multiple data files and each stands for one age group.
- If your data comes in multiple files, repeat step 2 to join each file to the population breakdown shapefile. Now your data is in wide format.
- For each field you created in step 1, right click on it and select Field Calculator. Calculate counts by multiply the rate to the corresponding age category. Note that you may need to sum up some age category if your rate's age group is not mutually exclusive. The equation you will put for the sample data will be [NC_HD_death_cnty_1315_35p.csv.Value] * ([NC_cnty_2010_join_pop.age35_65] + [NC_cnty_2010_join_pop.age65p]) and [NC_HD_death_cnty_1315_65p.csv.Value] * [NC_cnty_2010_join_pop.age65p].
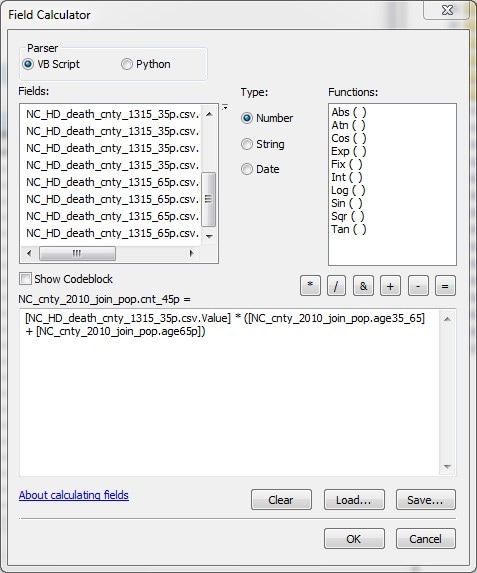
6. Now your data is all counts, you could continue to section B.
B) Simulate count data.
Simulate death count data is comparatively straight forward. Different data formats will result in slightly different simulation processes. If you have long format data (each geographic unit appears multiple times in the same table with different age groups), please go to section (i). If your count data was supplied in multiple data files, please go to section (ii). If you have wide format data (counts for different age groups store in different fields), please go to section (iii).
i. Simulate long format count data.
- To simulate long format data, first, split this file into multiple layers by the age group. Right click on your data file to Open attribute table. Click Table Options and Select by Attributes.
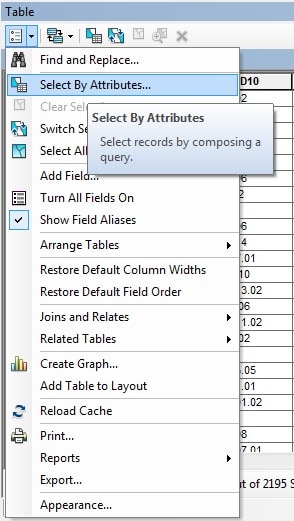
2. In the pop-up window, single click on your age field and then click on Get Unique Value.
3. Double click on your age field, and then click =, and then double click on the first age value. The selection query window will have an equation that looks like this in the image. And Click Apply.
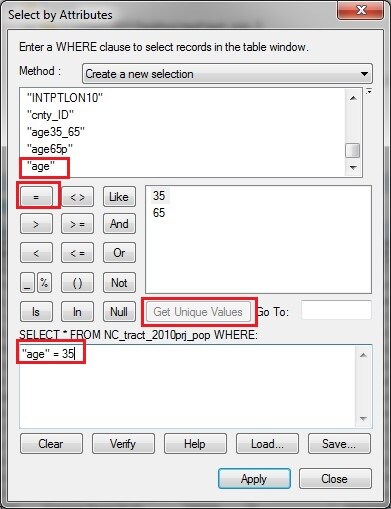
4. Now you've selected all counts that stand for 35 years and older in the example. Right click on the data layer, under Data section, click on Export.... Make sure you marked the output filename with the age group you selected.
5. Repeat step 1-4 for every age group. You will have multiple data files now, and each data file stands for a count for each census unit for each age group. And now you can process to section ii.
ii. Simulate multiple files count data.
- Before you work on the simulation, ensure that each of your death count files has the age category included in the name. If you changed the file name, please make sure you also change the corresponding name in the schema.ini file.
- For each file of an age group, join them with your shapefile container. To join the data, you need to right click on your shapefile, under Joins and Relates, click Join.... In the pop-up window, select the GEOID field (the actual name may differ slightly) for both parts of the join. Select Keep all records and Validate Join. Click OK if validation is successful.
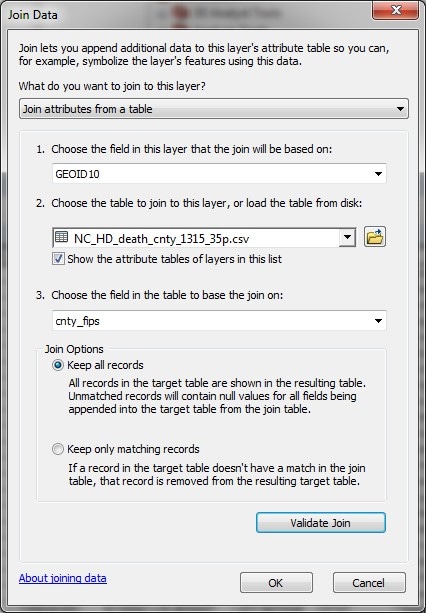
3. Repeat step 2 until you successfully join all death counts to the shapefile. And Open Attribute Table to check if all fields are correctly populated.
4. Click Search to open the search box. Search Feature Class to Feature Class and click on Feature Class to Feature Class (Conversion) in the search result.
5. In the pop-up, select your joined shapefile as Input Features, specify the output folder in Output Location and name it in Output Feature Class. In the Field Map (optional) section, click on the field that you don't need and click X on the side of it to remove it from the output. Rename count value field to something meaningful with the age category, as shown in the example. Usually, GEOID and counts are enough for the simulation process.
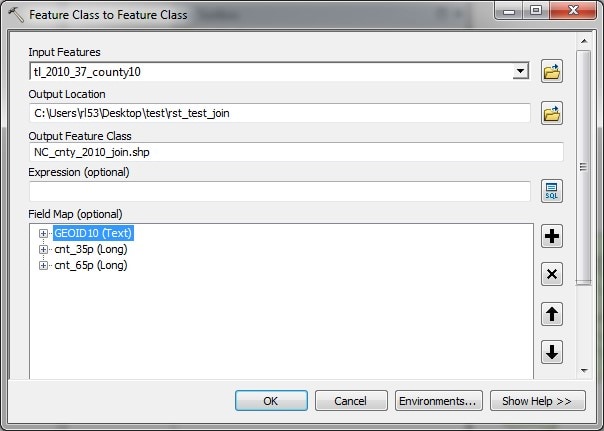
6. Now you've created wide format count data. You can process to section iii.
iii. Simulate wide format count data.
- Join your data to the shapefile if it is still in a table format. Right click on your shapefile, under Joins and Relates, click Join.... In the pop-up window, select the GEOID field (the actual name may differ slightly) for both parts of the join. Select Keep all records and Validate Join. Click OK if validation is successful.
- Please check if your age categories are mutually exclusive. If your age categories are not, for example, you have death counts for 35-years-old and over and 65-years-old and over. The former counts actually include latter counts. In this case, you will need to calculate the count for each individual age group. Otherwise, you can skip steps 3 and 4.
- To calculate death counts for each independent age category, you need to create a new field for each age category. For example, if you have 3 age categories: 35 plus, 45 plus, and 65 plus, then you need to create 2 new fields for age 35 to 45, and 45 to 65. Right click on your shapefile and Open Attribute Table. Click on Table Options and then select Add Field.... In the pop-up window, Name the new field and set the data Type as Long Integer and click OK. Please start your field name with a letter instead of numbers or special characters. Repeat this step until you have all independent age categories created as a single field.
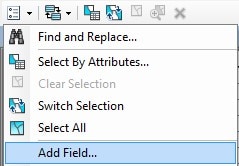
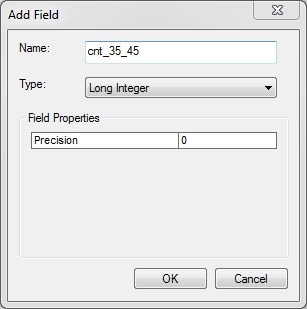
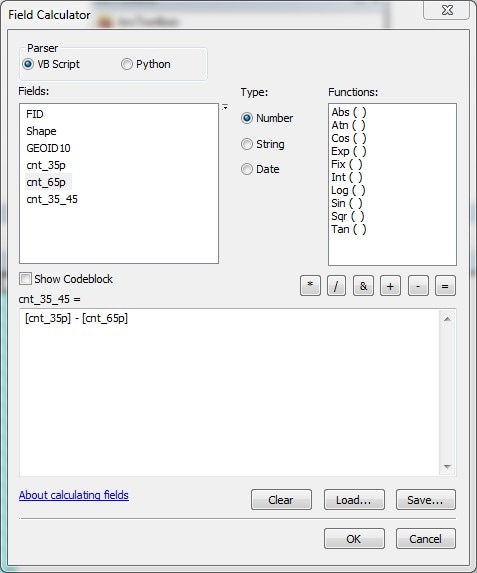
4. Now you need to calculate the counts for those fields you created in step 3. Right click on the new field you created and select Field Calculator.... Before you type in the equation, please take your pen and draw a single graph to help memorize the equation. In our previous example, you have death counts for 35 and up, 45 and up, and 65 and up. Based on the graphic shown below, to generate the counts for 35 – 45, we need an equation as [cnt_35_45] = [cnt_35p] – [cnt_45p]. Similarly, you can calculate for cnt_45_65 as well.

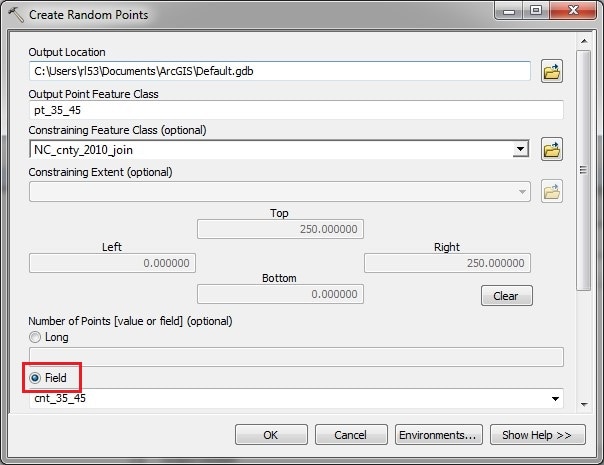
5. Now you are going to simulate those points in each census unit. Click Search to open the search box. Search Random points and click on Create Random Points in the search result. Set the output folder and output name in the first 2 blanks. Select the shapefile with recently calculated case counts for each age group in Constraining Feature Class (optional). Under Number of Points [value or field] (optional) section, check Field, and then select the first age category you want to put in. In the previous example, it will be cnt_35_45. And then click OK.
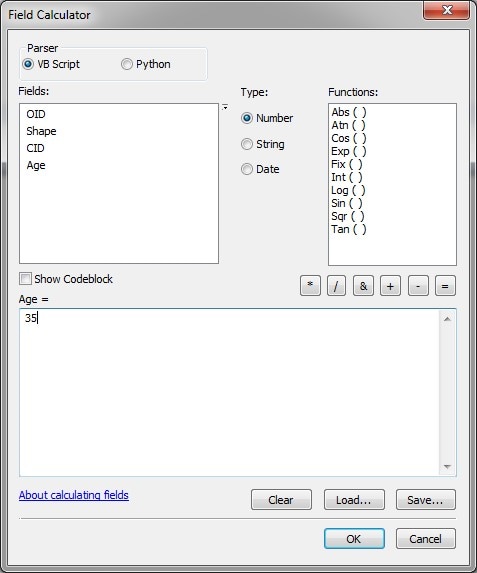
6. Now you can see the random points that you simulated for those death cases. You will need to add an age field for it. Right click on your shapefile and Open Attribute Table. Click on Table Options and then select Add Field.... In the pop-up window, Name the new field as Age and set the data Type as Long Integer and click OK. Right click on Age field and select Field Calculator. In the equation box, type in the lower bound of your current age category. In the example, it will be 35.
7. Repeat steps 5-6 until you have calculated for each mutually exclusive age category. In the example, you need to repeat these processes 3 times because we have 3 different age categories.
8. Next, go to the top level menu. Click on Geoprocessing and select Merge.
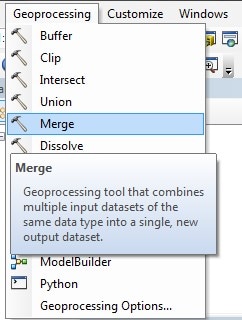
9. In the Merge window, select all random point layers you created in steps 5-6. Give it an output name and location and click OK.
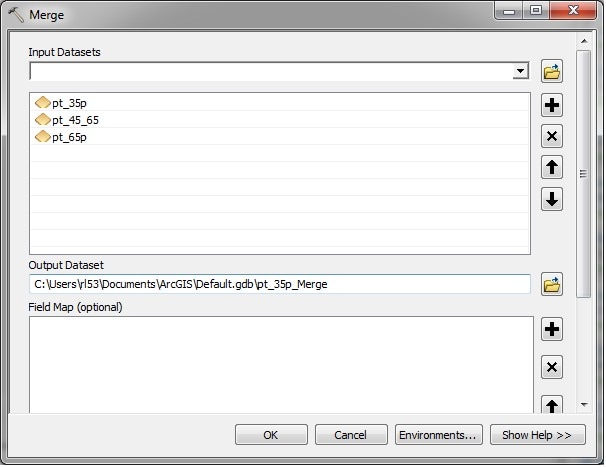
10. Now you have simulated points that contain all age categories with the field of Age. The last step is to join the geographic unit identifier to your simulated data for the future calculation. Click Search to open the search box. Search spatial join and click on Spatial Join (Analysis) in the search result. Because we are trying to attach GEOID to your simulated point, the merged points will be our Target Features; and the shapefile with GEOID will be your Join Features. Name it accordingly and remove the fields for which you are not interested. Make sure you keep the age field and the GEOID field. Then click OK.
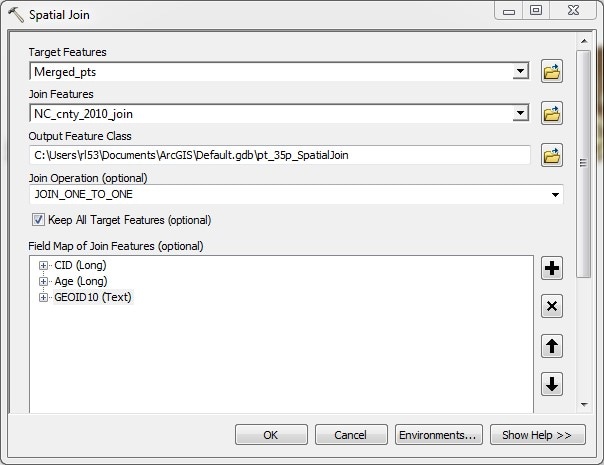
11. Now you can start to use your newly generated simulation points in RST to generate an age-adjusted smoothed rate.
