
Social Determinants of Health

Quick Maps
For Everyone

About

Download ready-made, high-quality national maps of county-level patterns of social determinants of health.

Social determinants of health

Social determinants of health (SDOH) are the nonmedical factors that influence health outcomes. They are the conditions in which people are born, grow, work, live, and age. Negative SDOH have been found to increase the burden of heart disease and stroke and their risk factors.
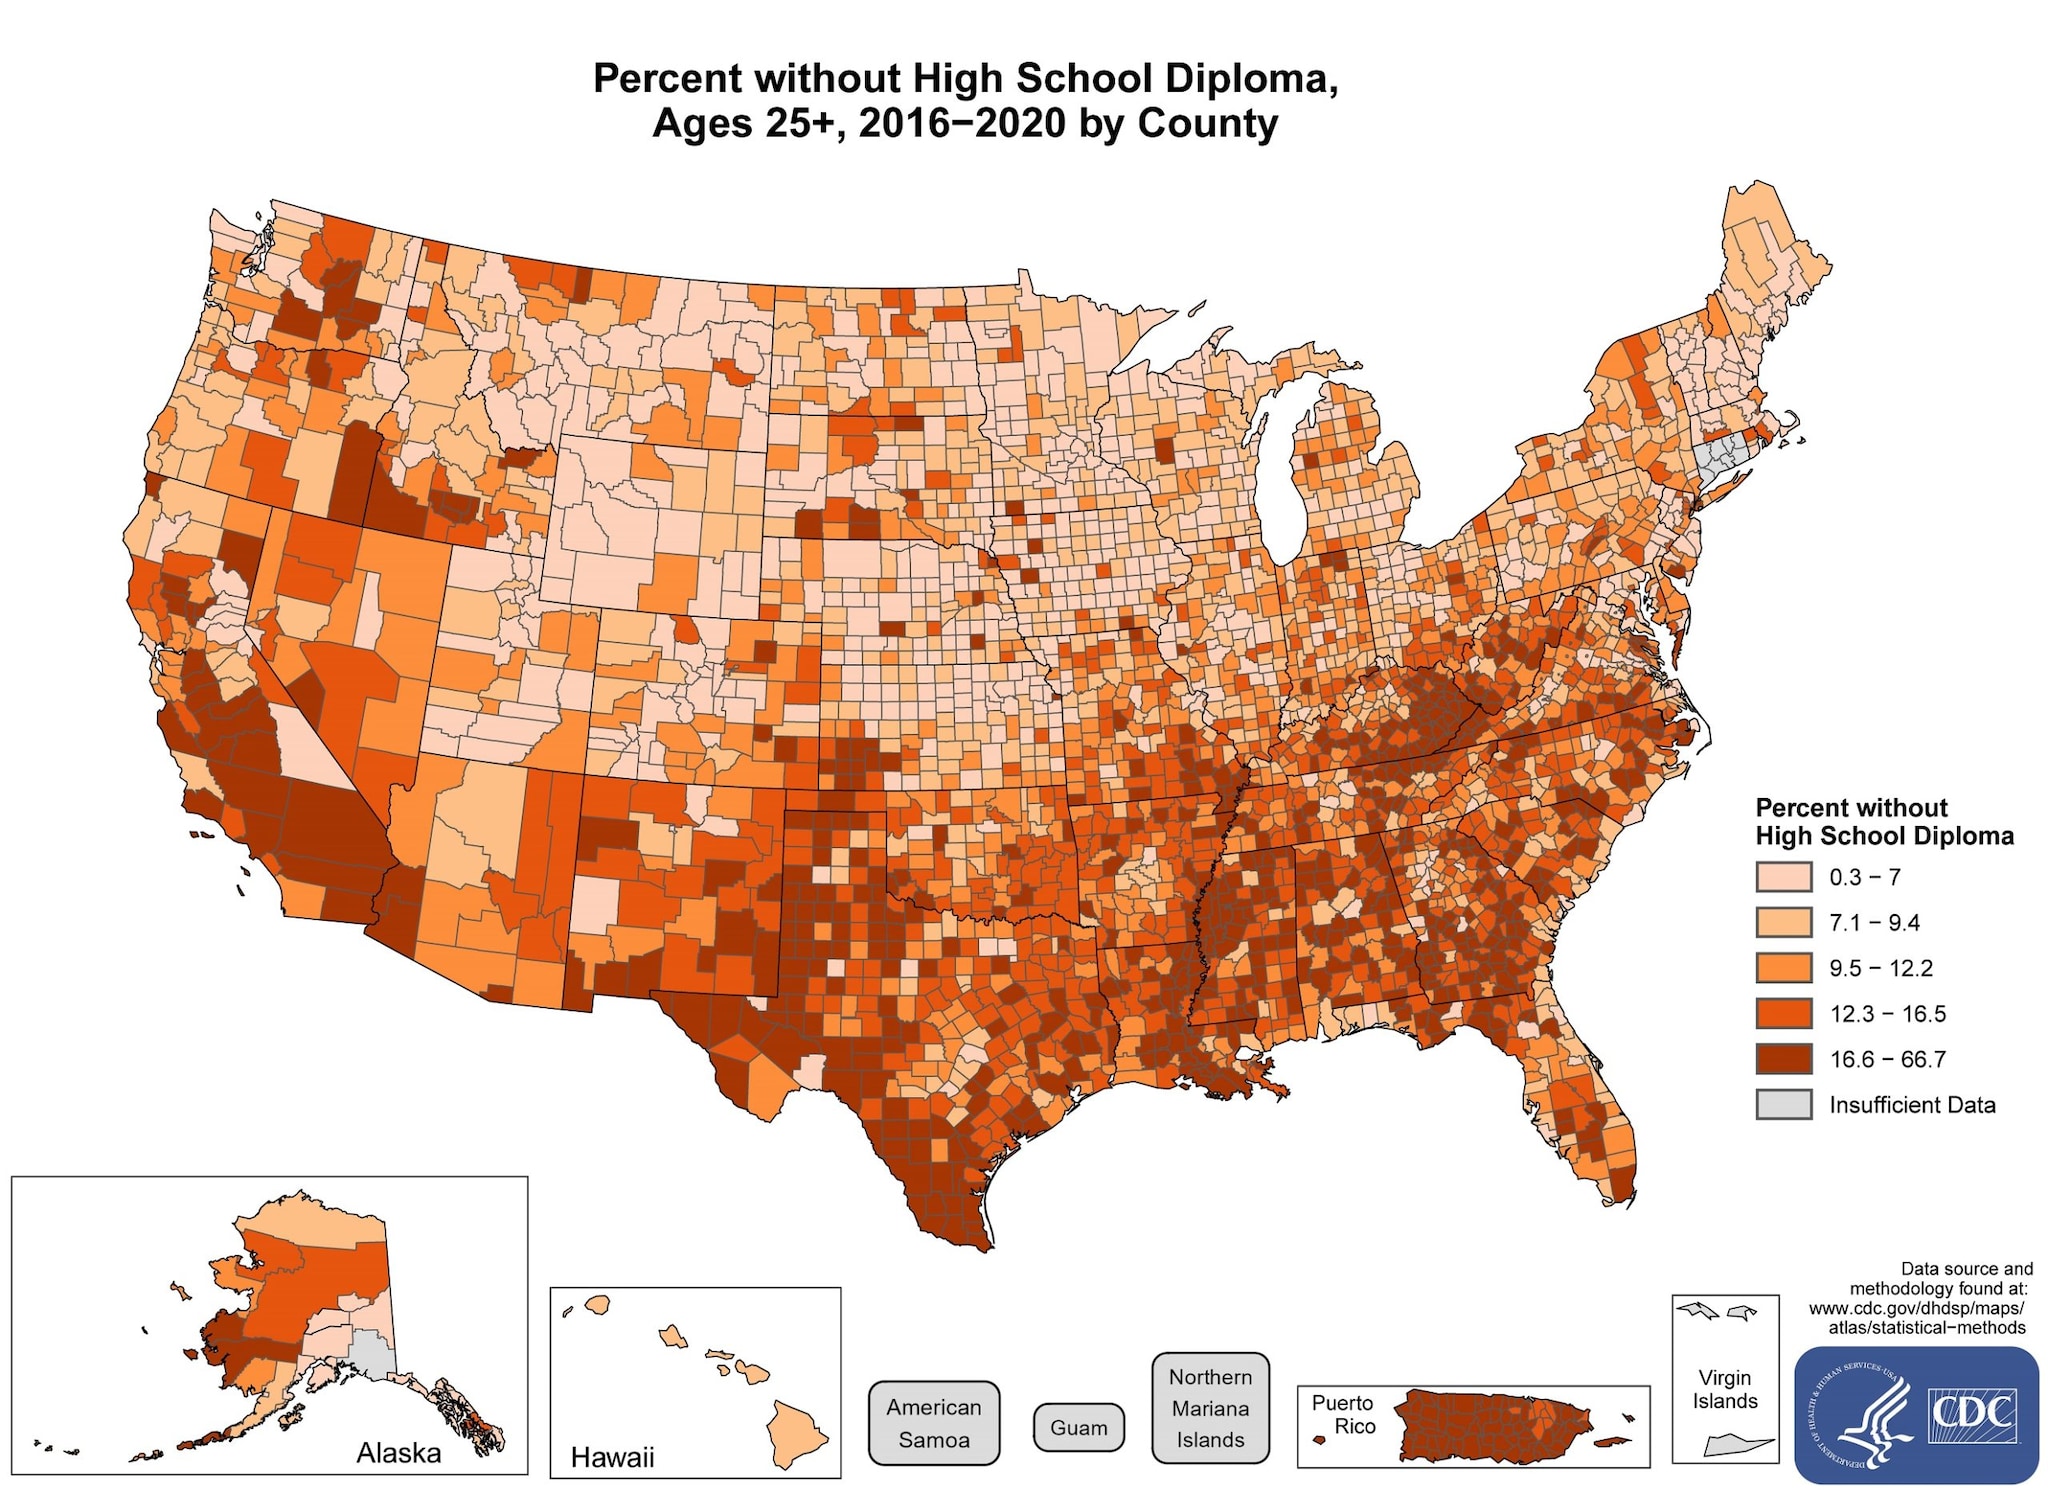
Counties with the highest percentage without a high school diploma (i.e. top quintile) for 2020-2024 were located primarily in California, Texas, Louisiana, Mississippi, Alabama, Georgia, Puerto Rico, and Kentucky. Pockets of high-rate counties are also found in West Virginia, Virginia, North Carolina, South Carolina, Tennessee, Florida, Arkansas, Kansas, Idaho, Oregon, Alaska. The county distribution of the percentage of the population ages 25 and older with less than a high school degree ranged between 0% and 47.2%.
Percent without high school diploma aged 25 or older, 2020–2024, by county

View the text description of this map.
Resource

To create your own county-level high school education map, visit the Atlas of Heart Disease and Stroke.

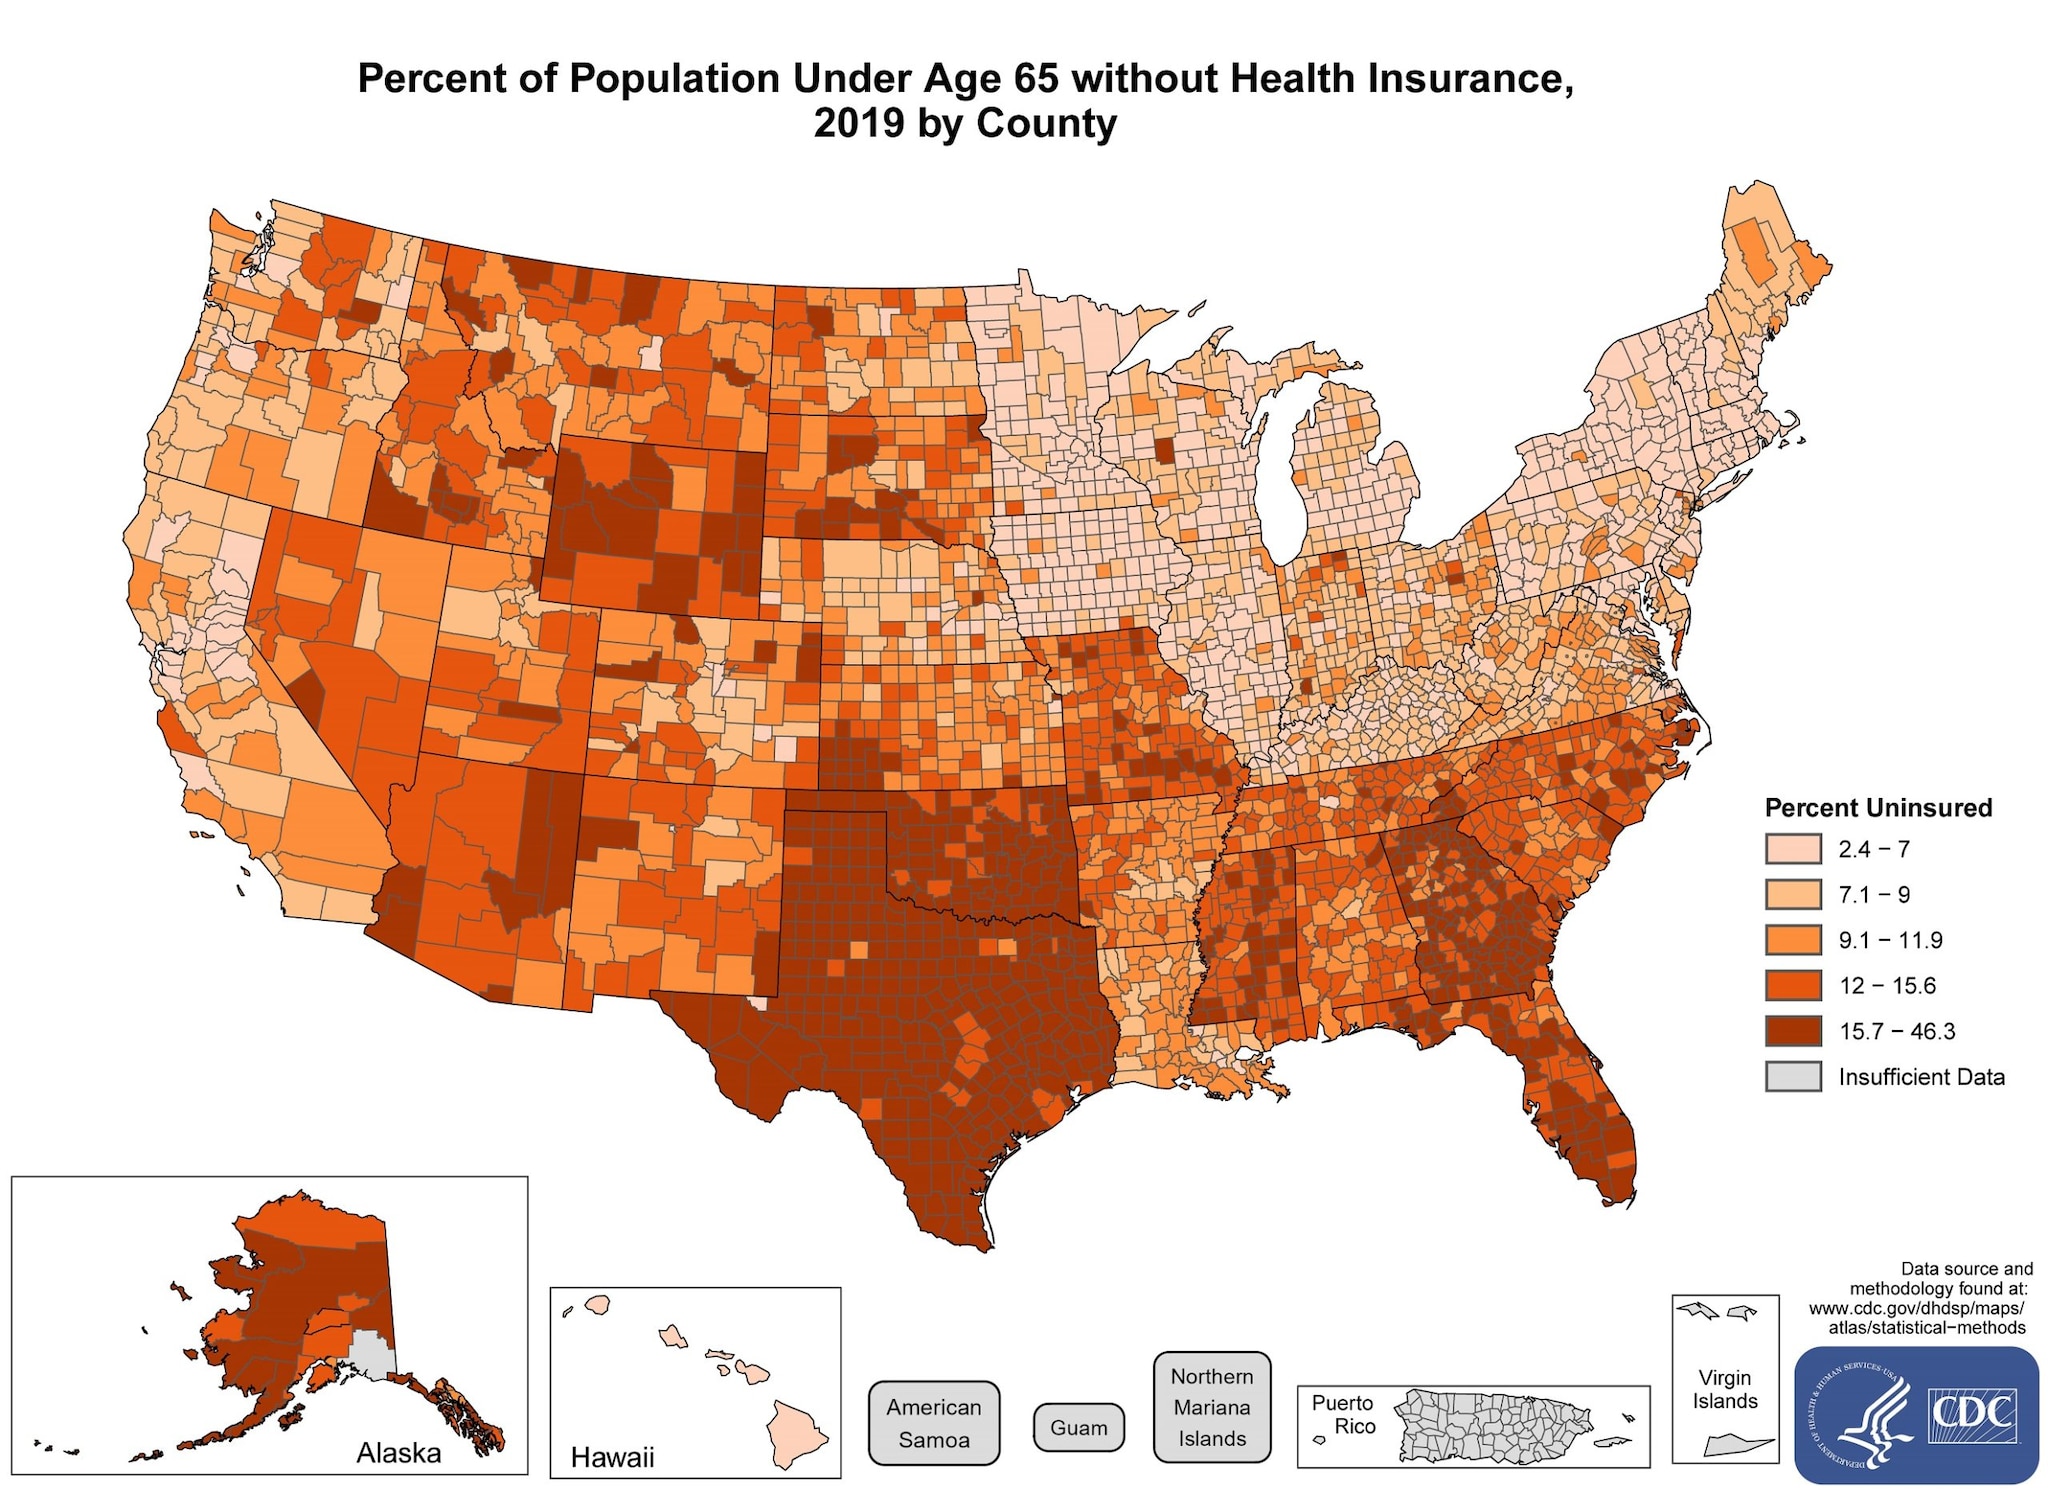
Counties with the highest percentage of the population under age 65 without health insurance (i.e. top quintile) in 2023 were located primarily in Florida, Georgia, Texas, Oklahoma, Wyoming, and Alaska. Pockets of high-rate counties are also found in Idaho, Washington, New Mexico, Arizona, Kansas, Missouri, Arkansas, Mississippi, Alabama, Tennessee, North Carolina, and South Carolina. The county distribution of the percentage without health insurance ranged between 2.1% and 33.5%.
Percent of population under age 65 without health insurance, 2023, by county

View the text description of this map.
Resource

To create your own county-level health insurance map, visit the Atlas of Heart Disease and Stroke.

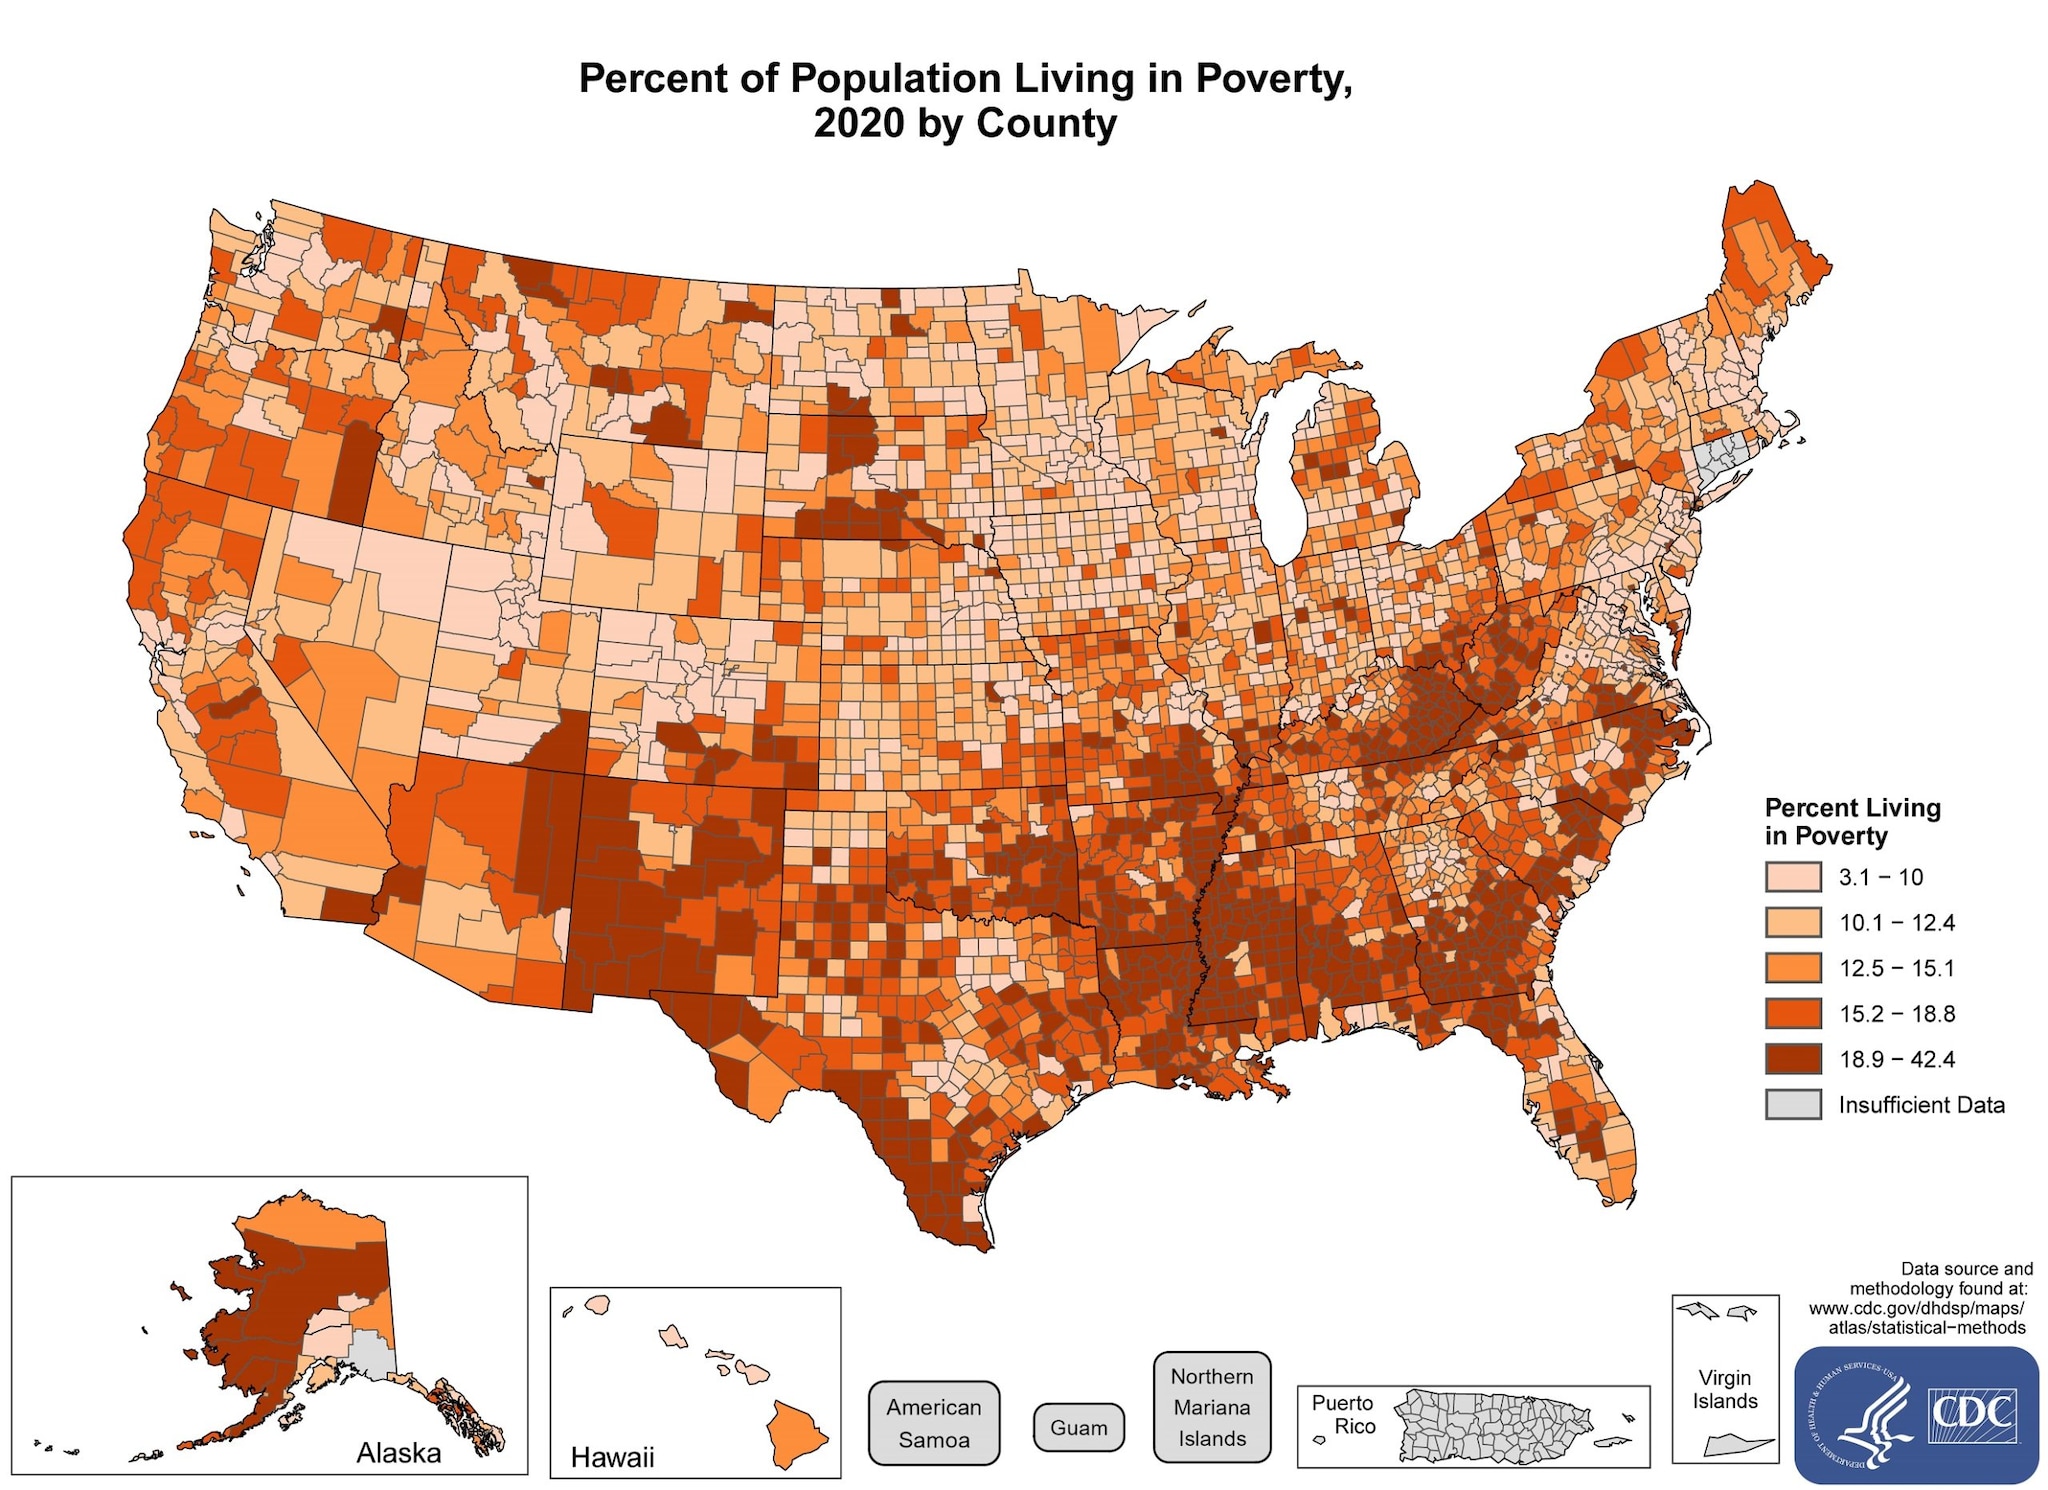
Counties with the highest percentage of the population living in poverty (i.e. top quintile) in 2024 were located primarily in West Virginia, Kentucky, North Carolina, South Carolina, Georgia, Alabama, Mississippi, Arkansas, Louisiana, Florida, Oklahoma, Texas, New Mexico, and Alaska. Pockets of high-rate counties are also found in Arizona, California, Montana, South Dakota, Colorado, Missouri, and Michigan. The county distribution of percentage living in poverty ranged between 3.8% and 55.7%.
Percent of population living in poverty, 2024, by county

View the text description of this map.

Resource

To create your own county-level poverty map, visit the Atlas of Heart Disease and Stroke.