At a glance
Heart disease death rates
Maps show death rates by county for the United States and US territories.
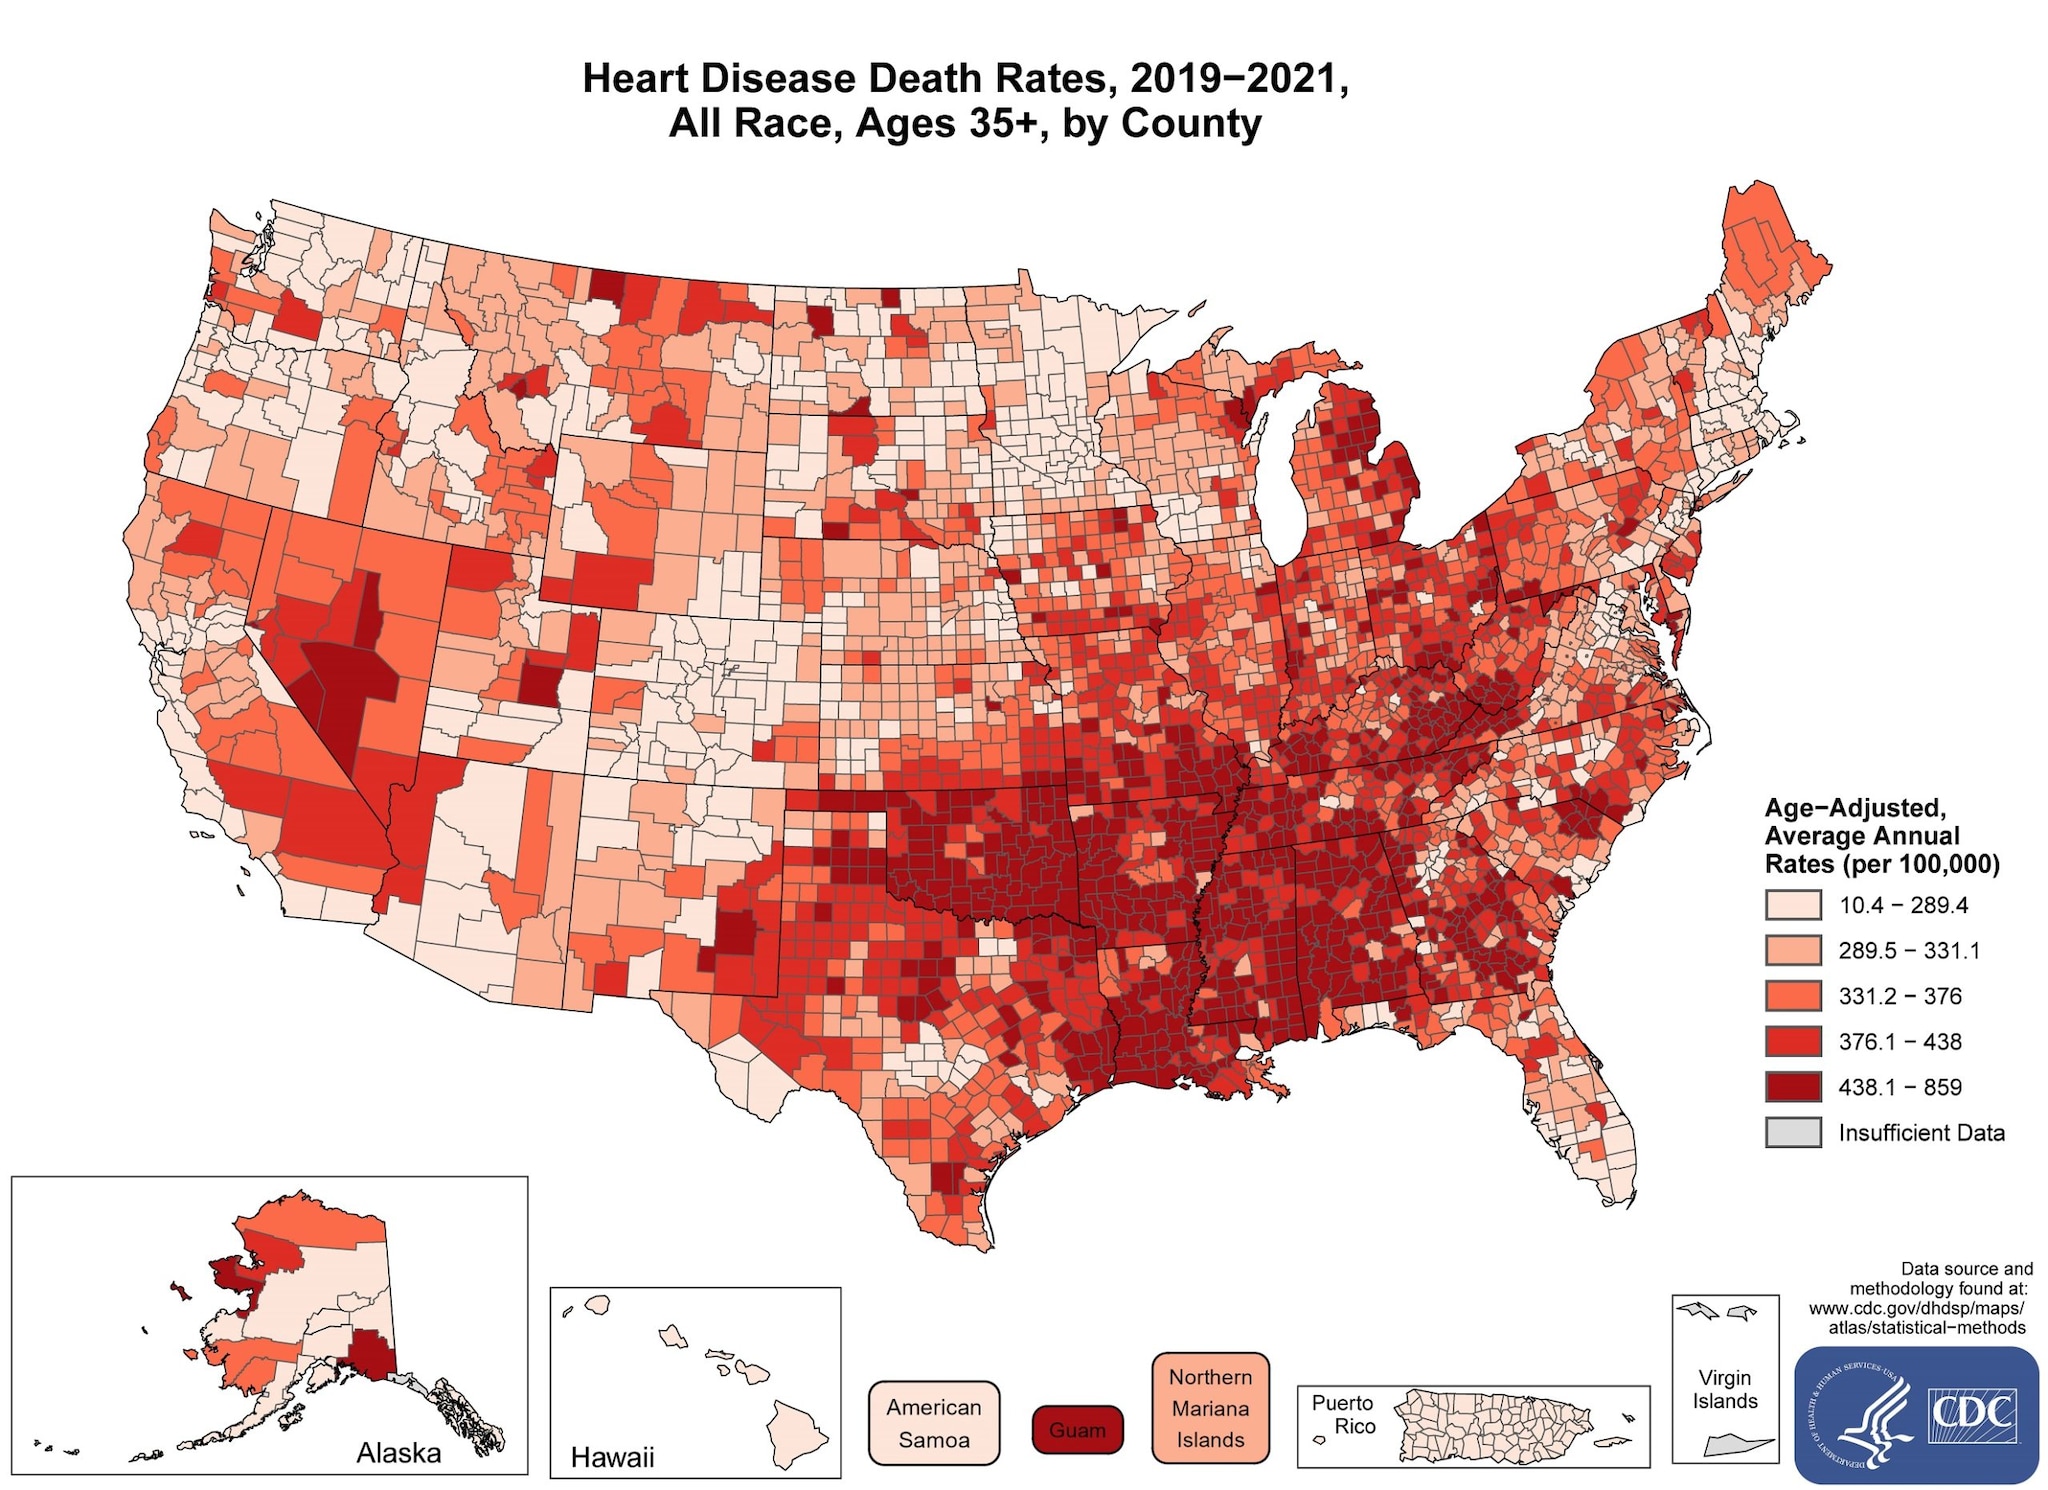
View the text description of this map.
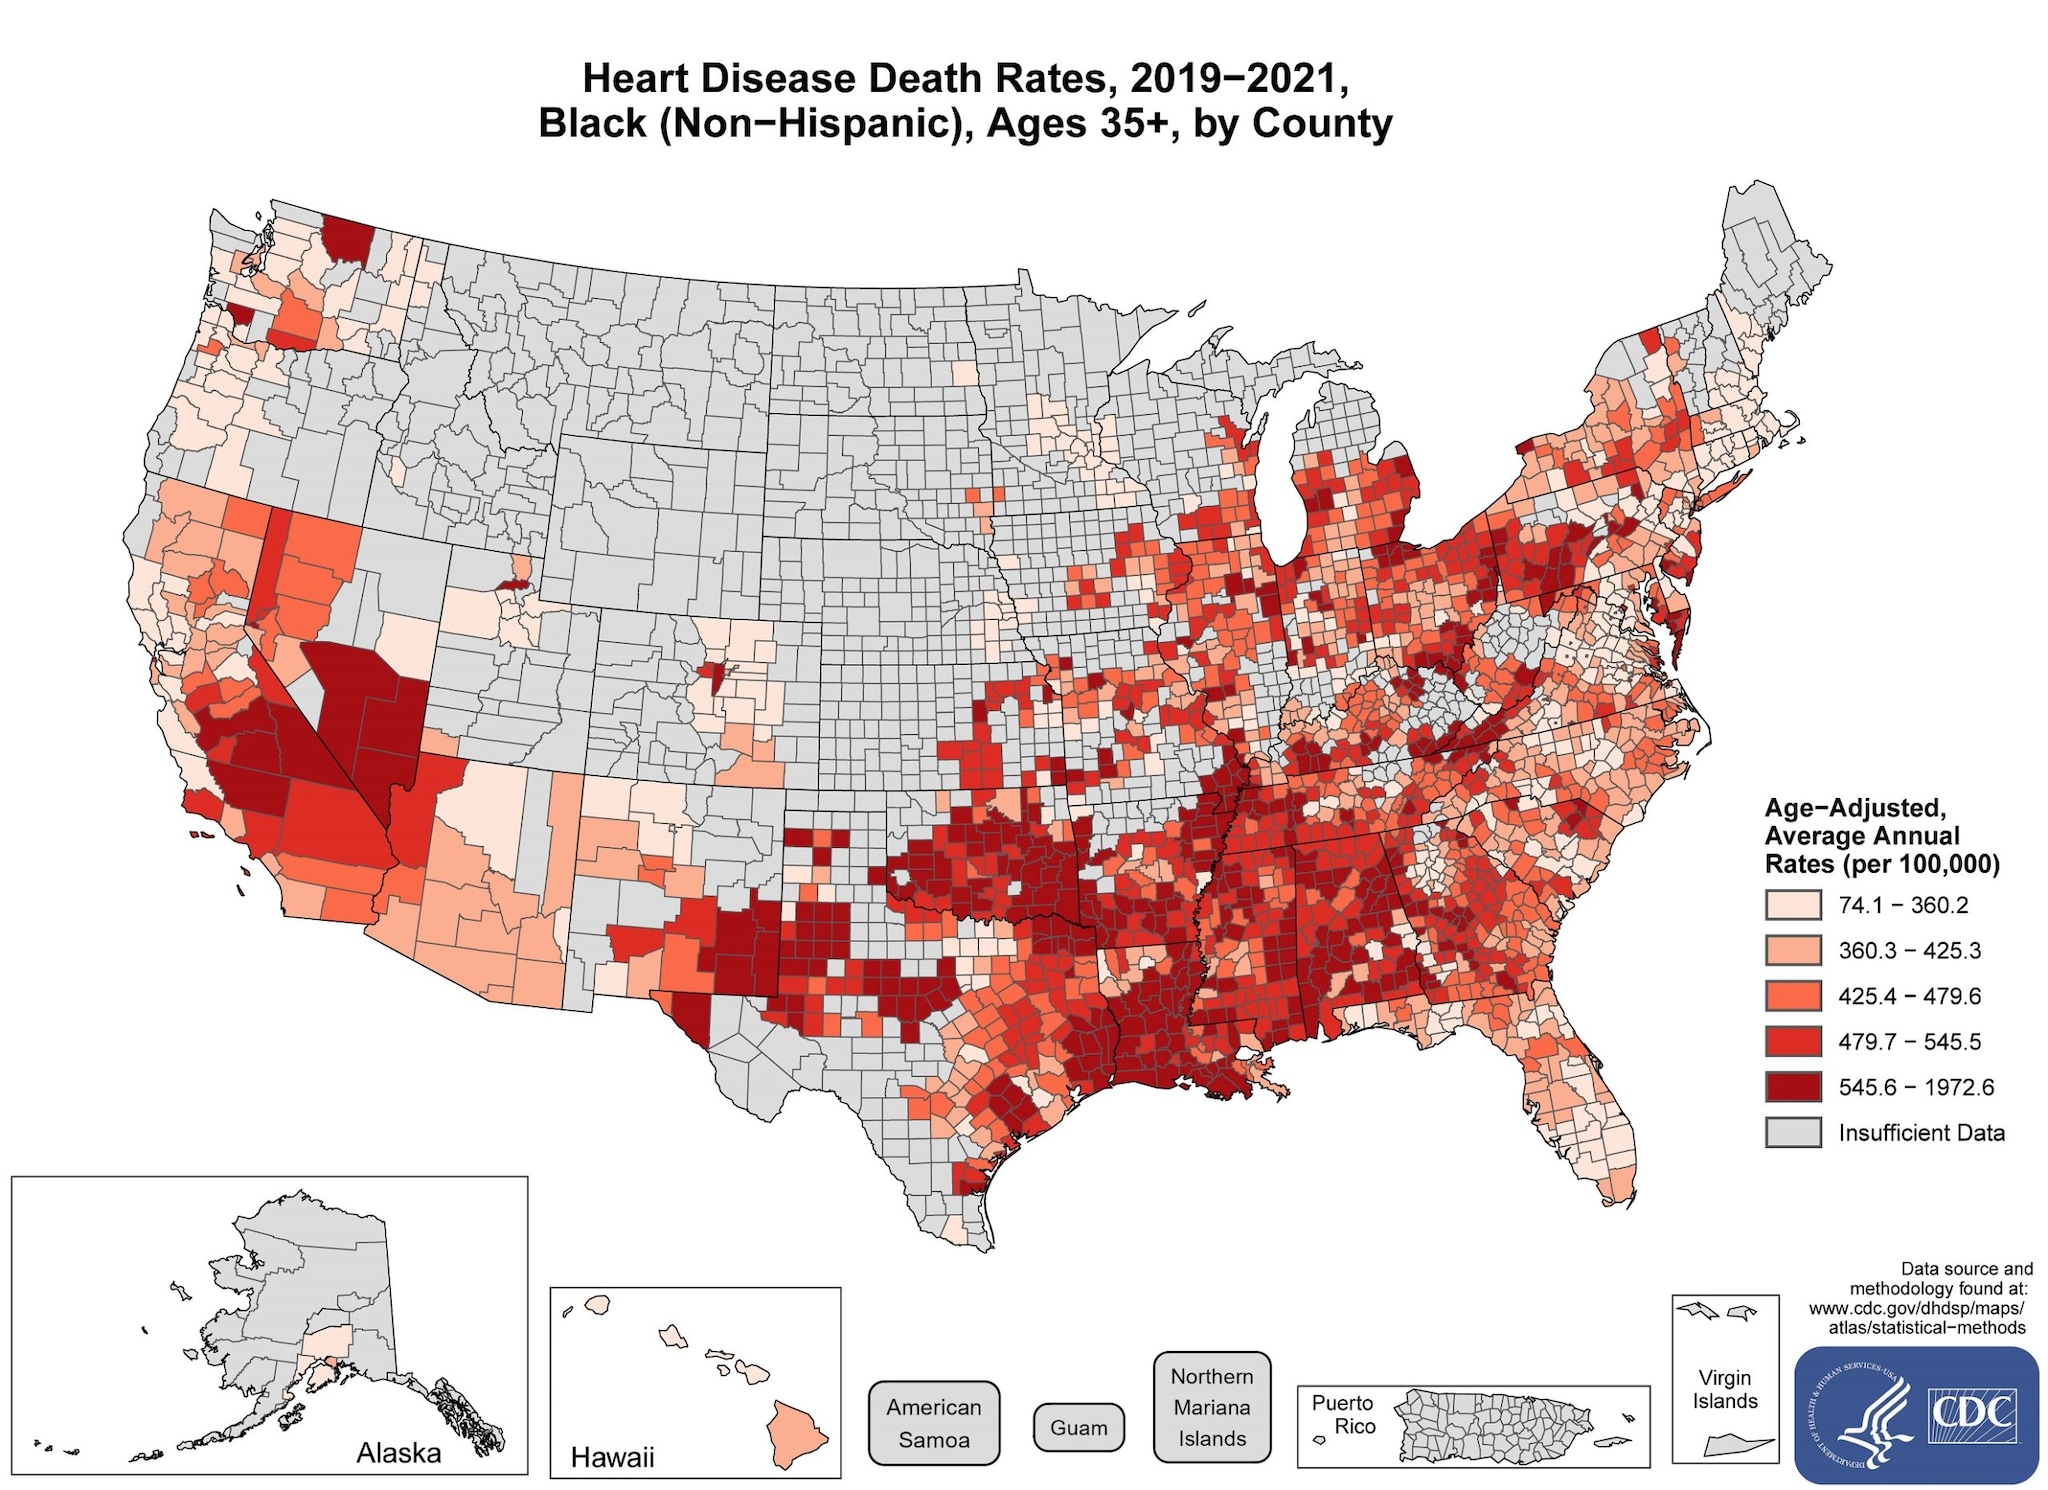
View the text description of this map.
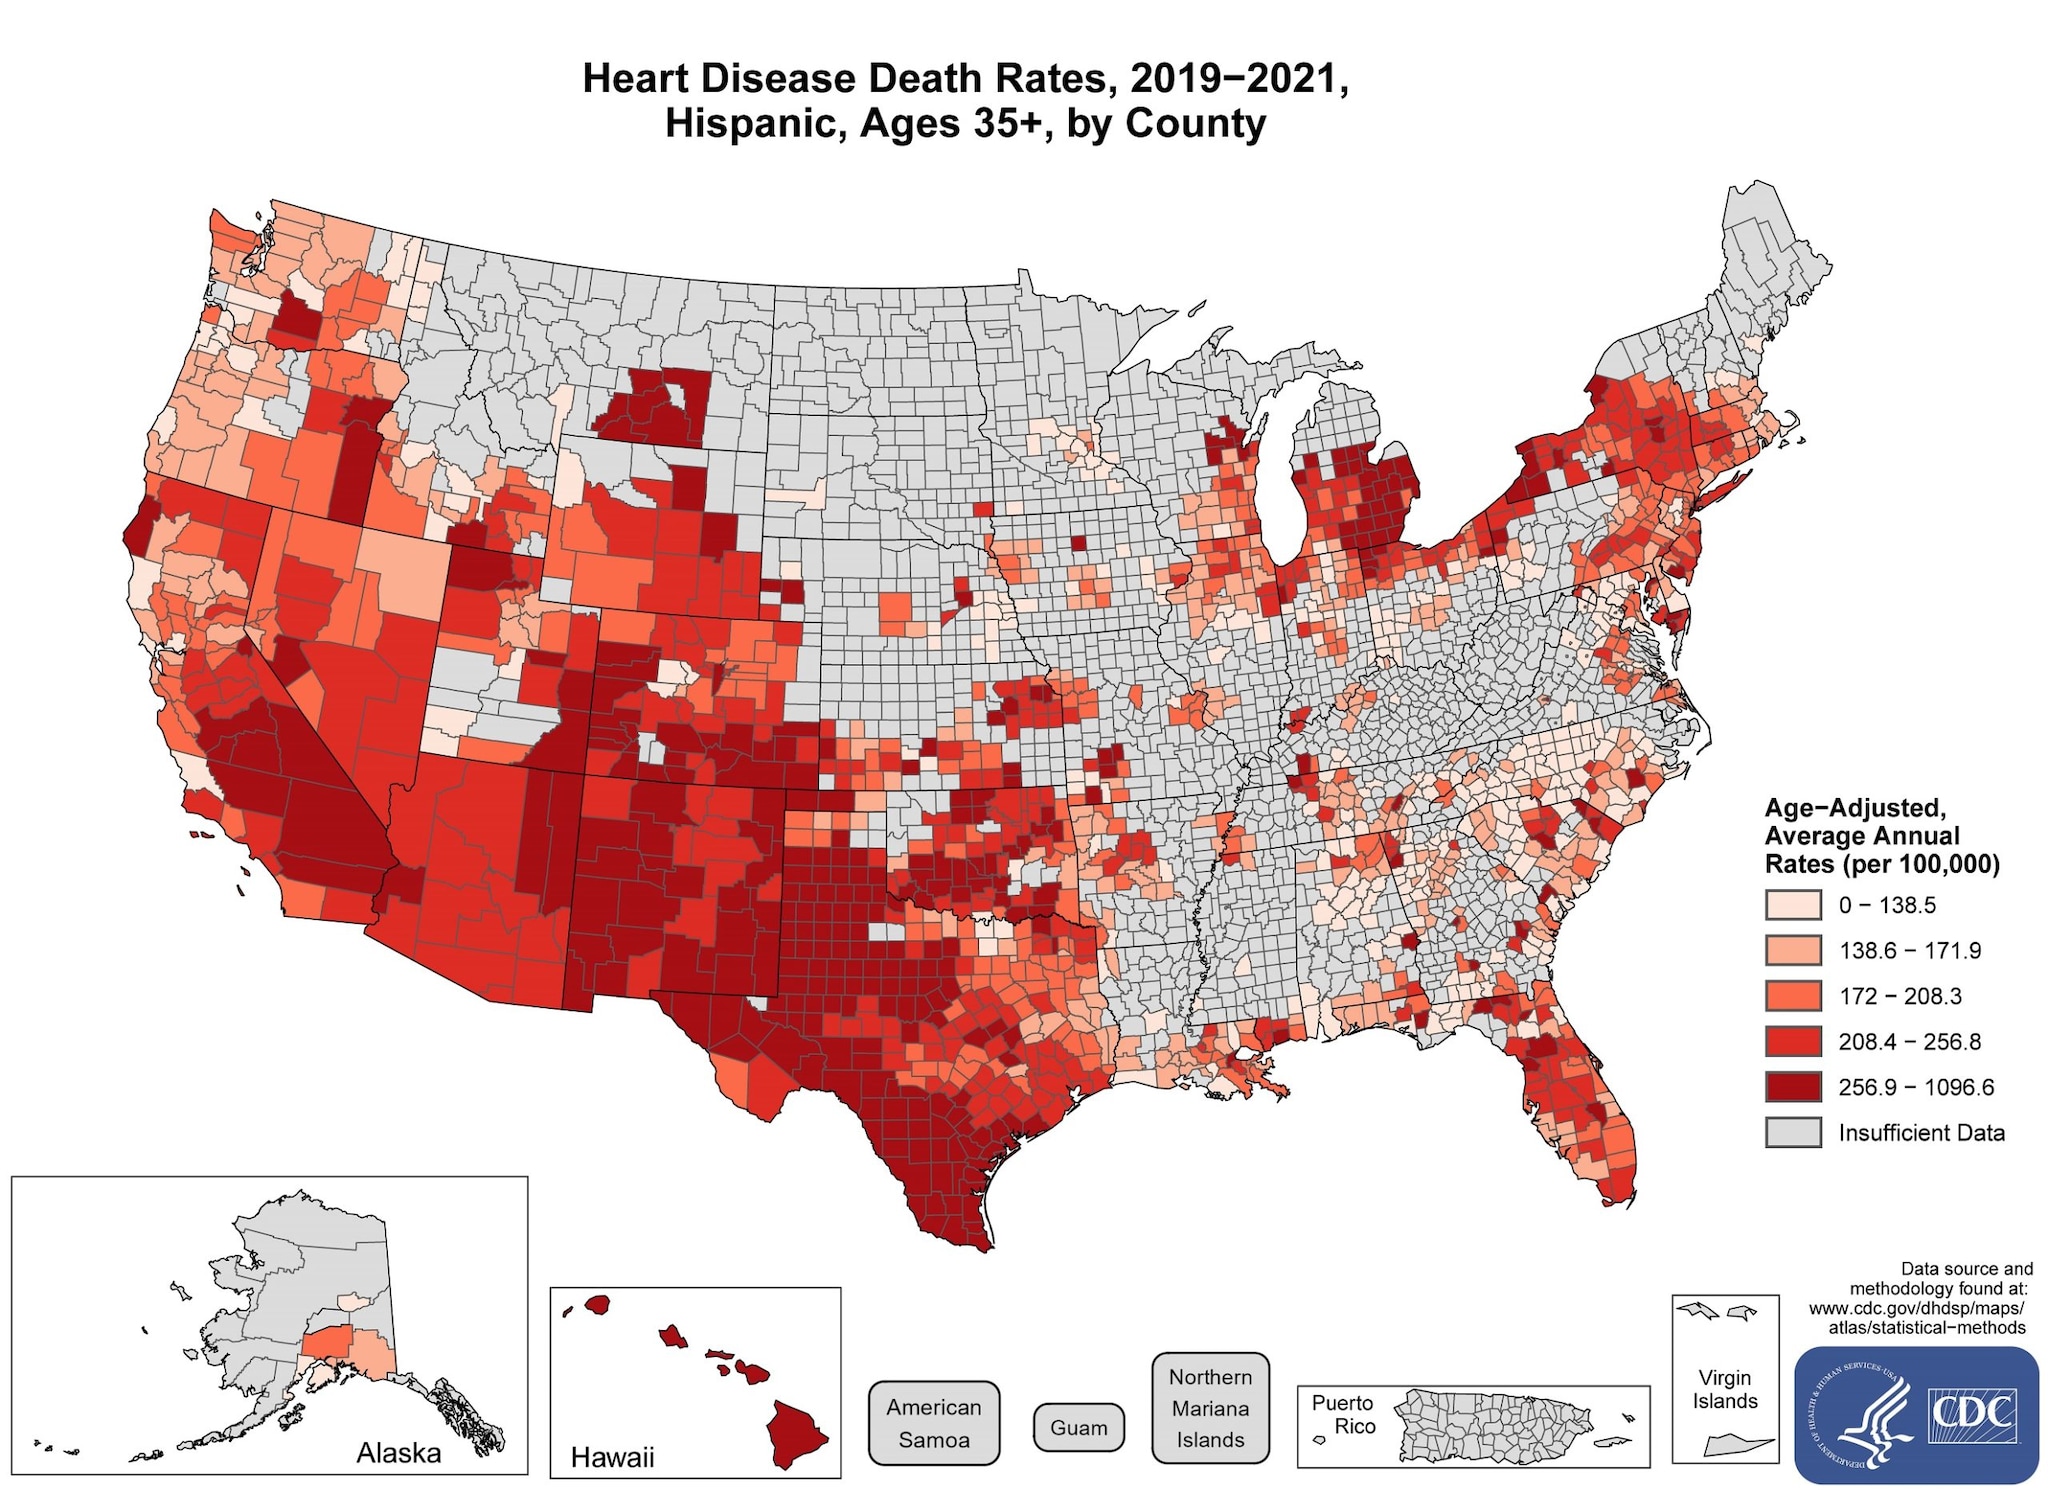
View the text description of this map.
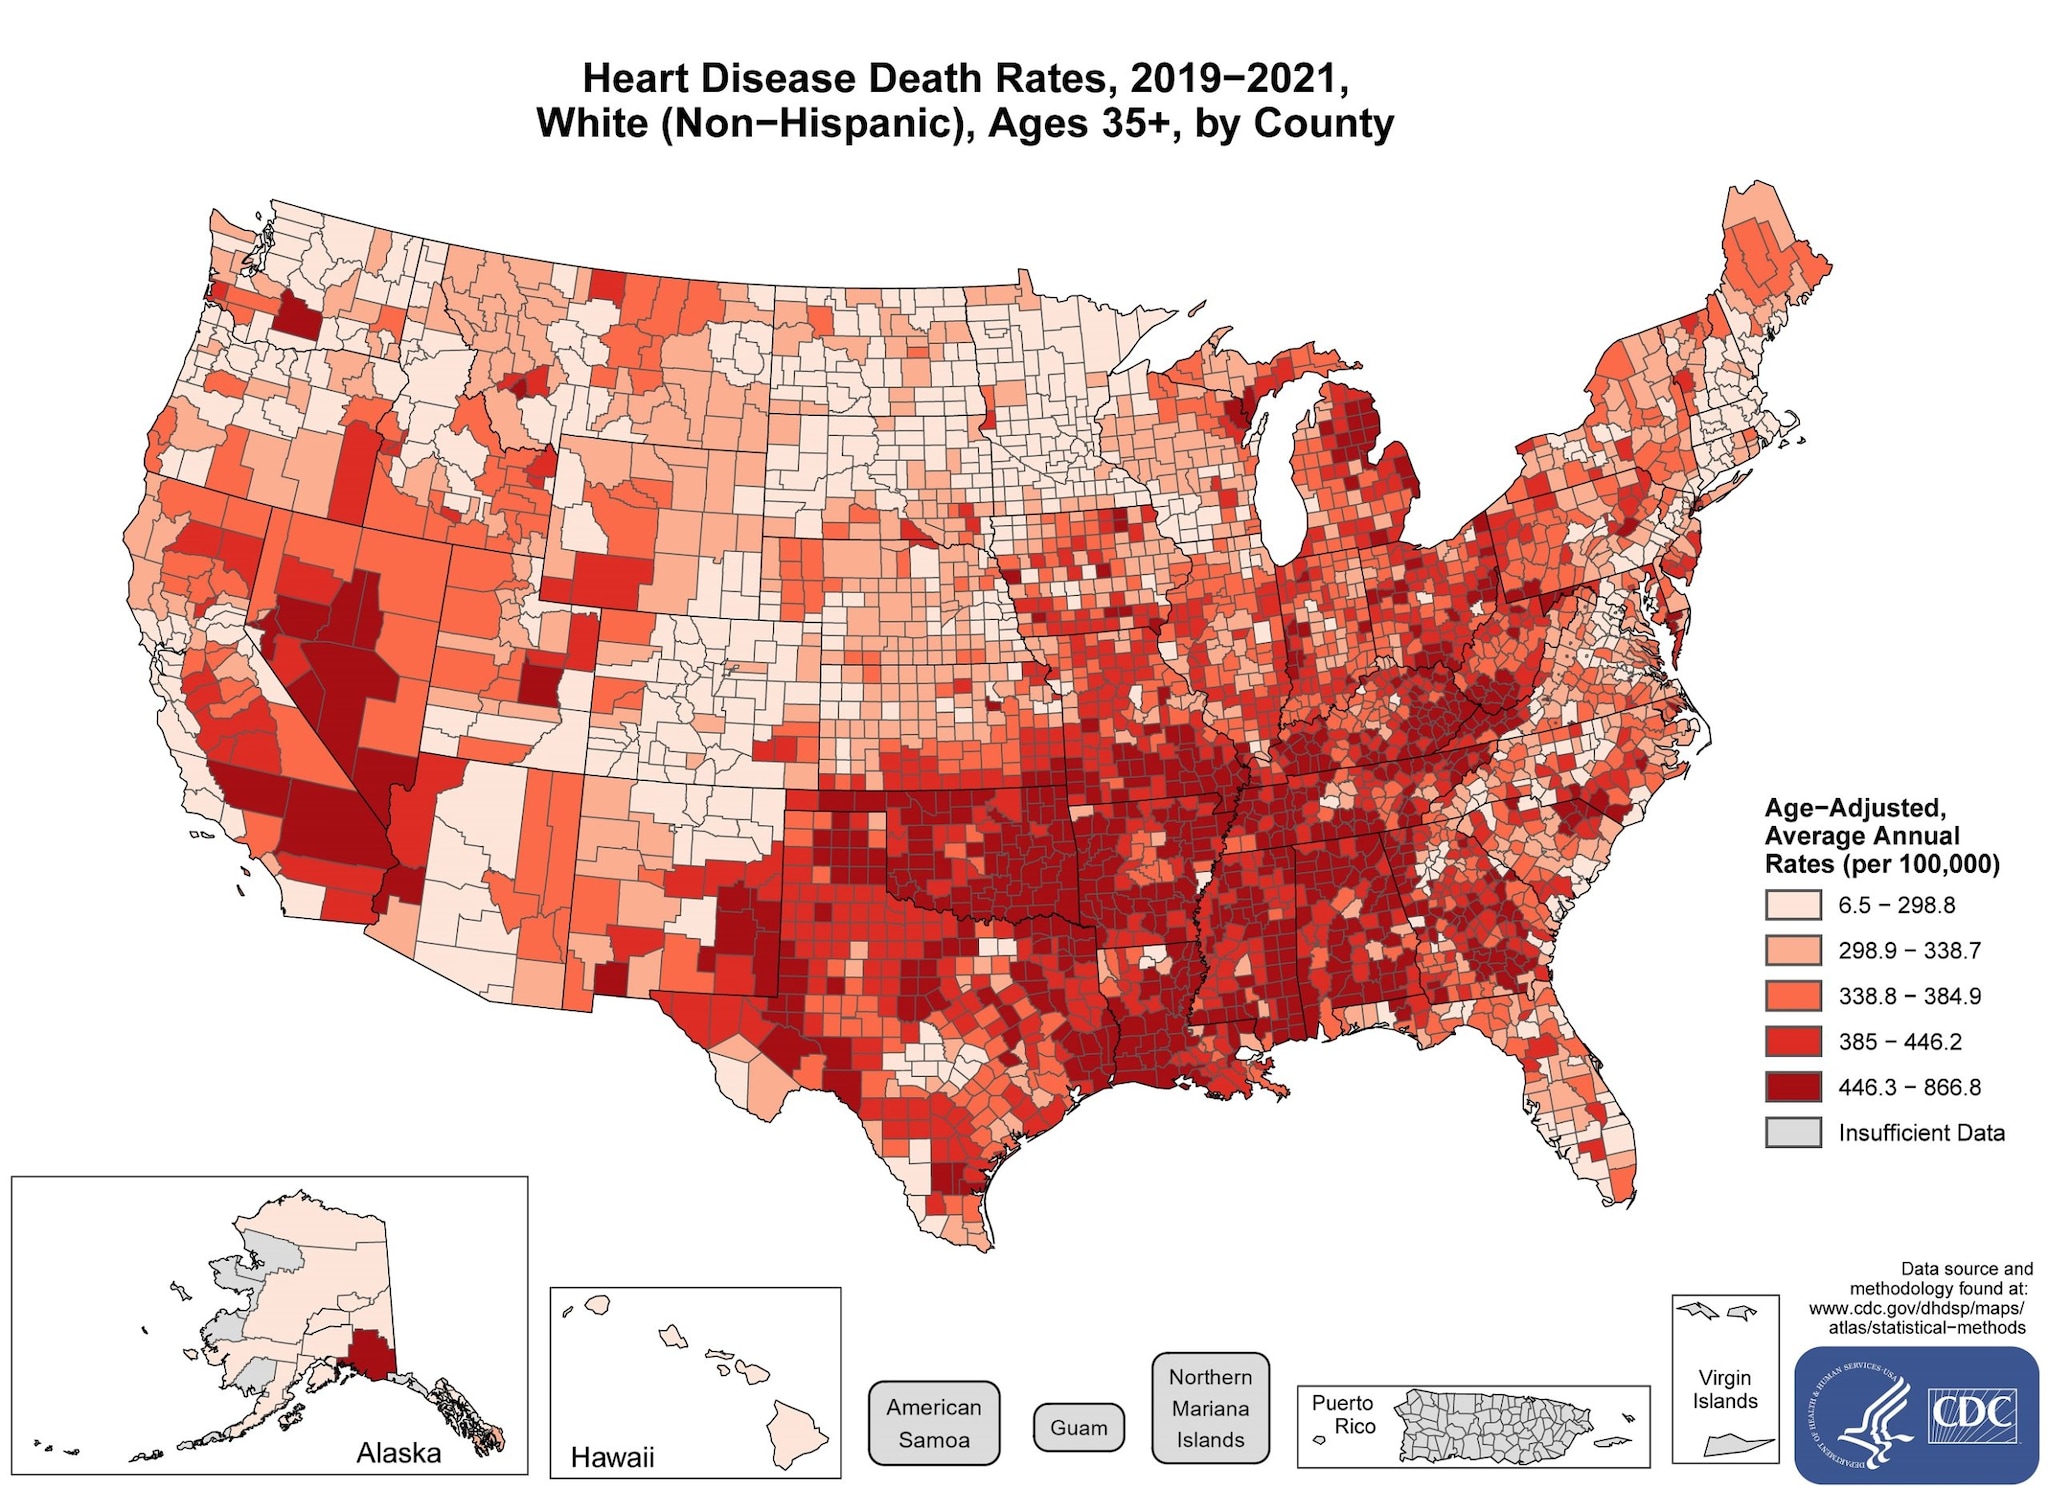
View the text description of this map.
Heart disease hospitalization rates
Maps show death rates by county for the United States and US territories.
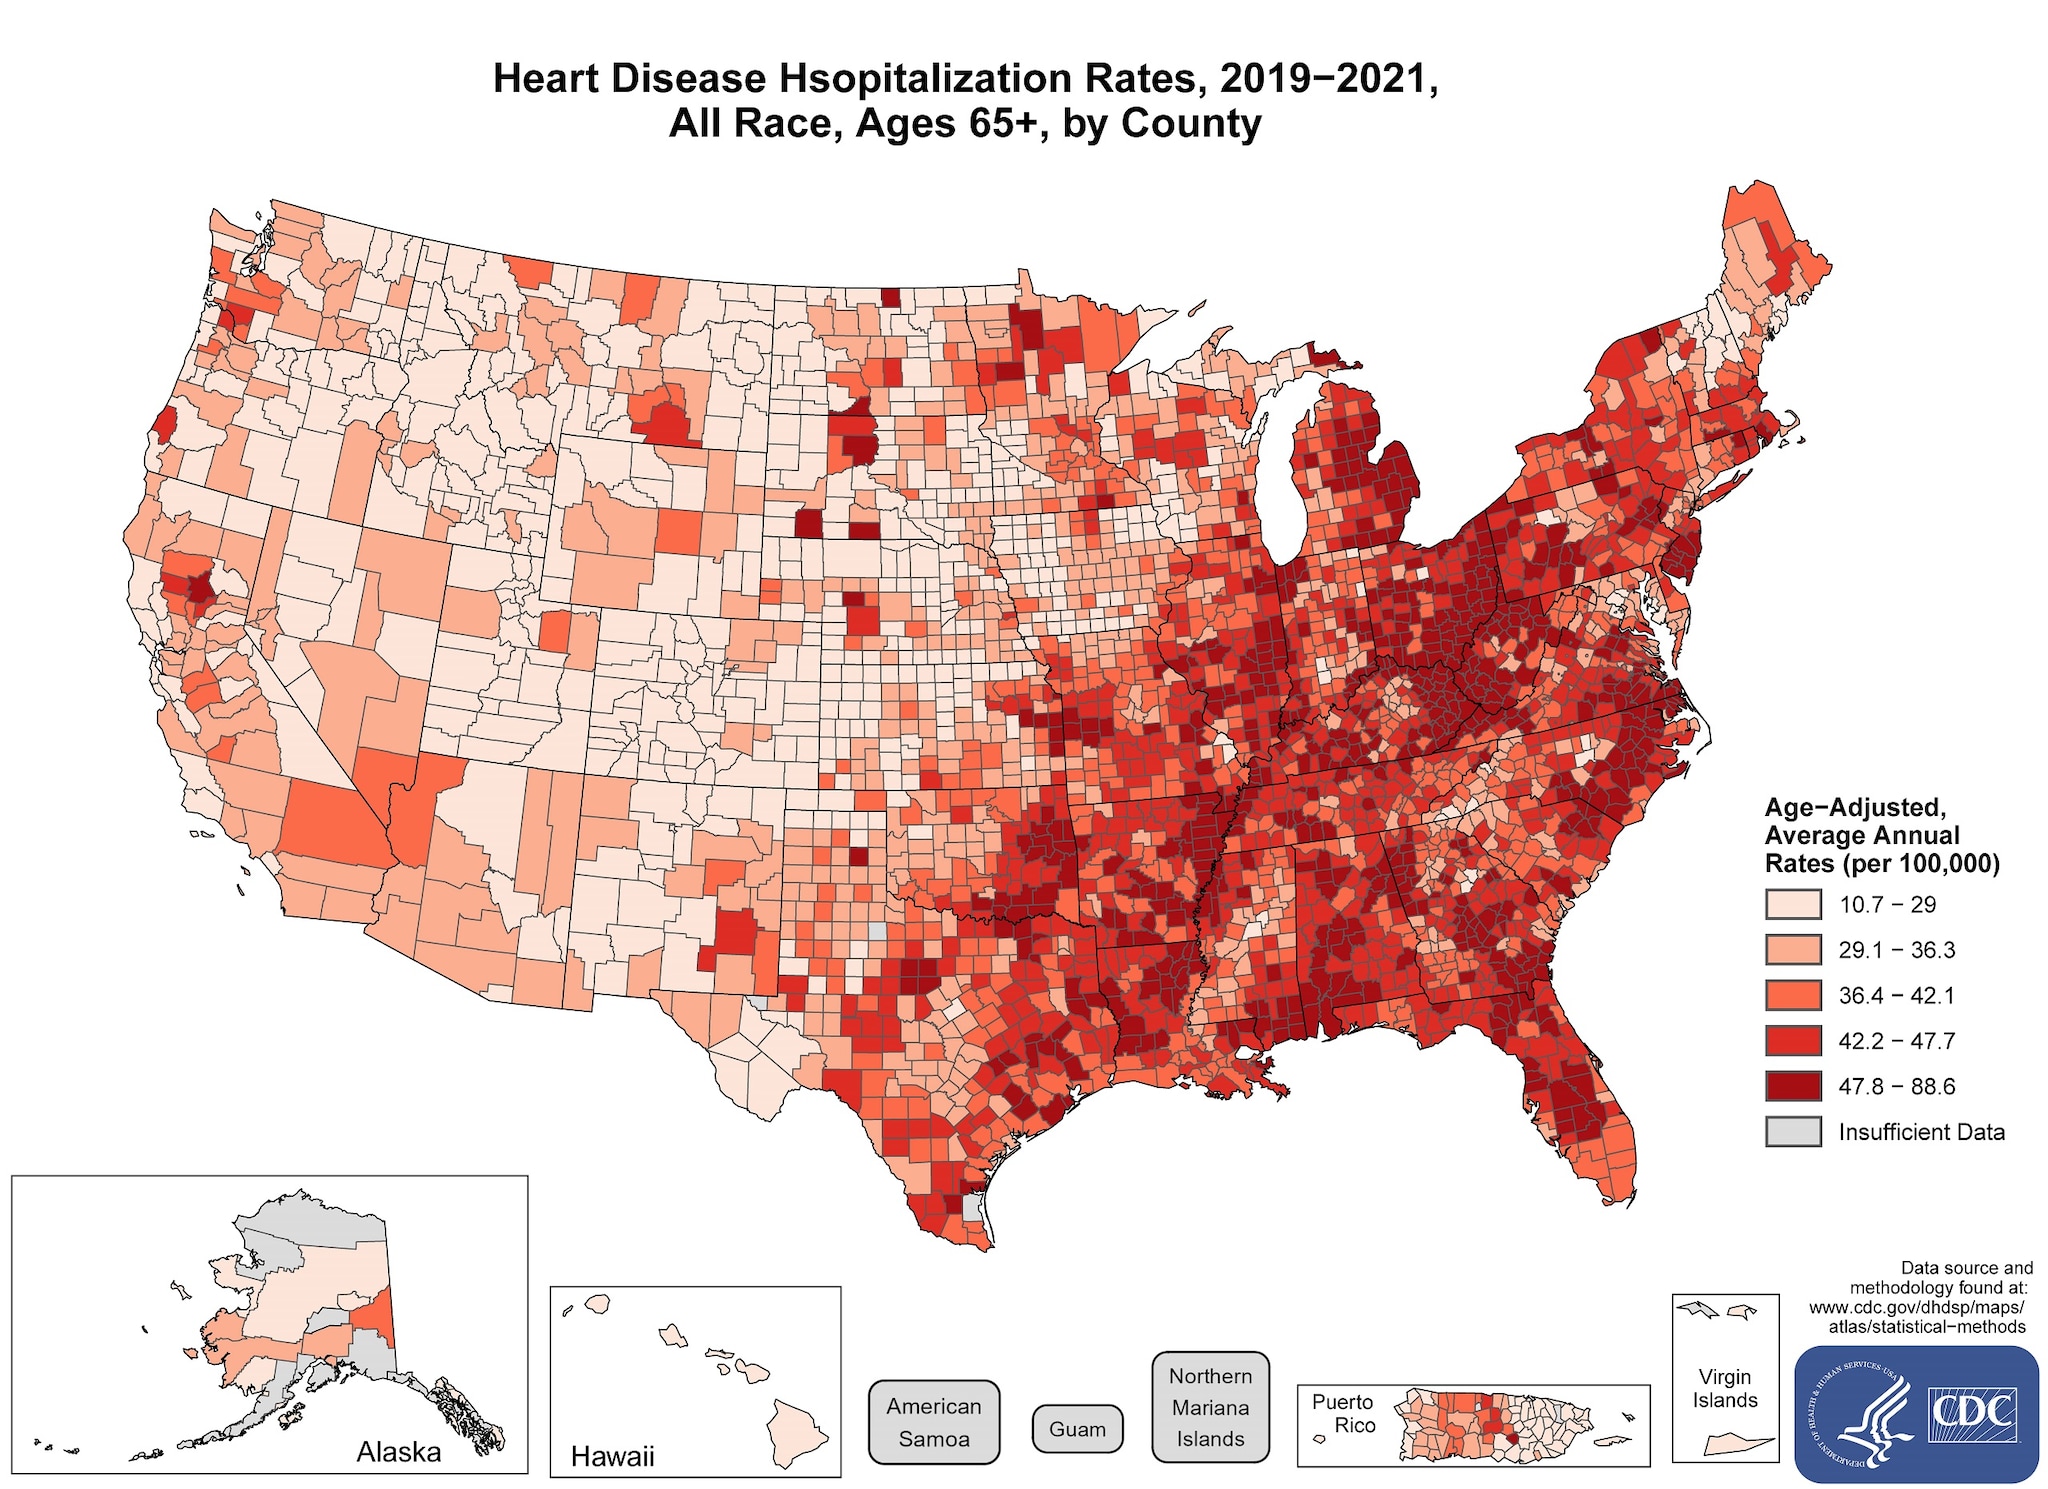
View the text description of this map.
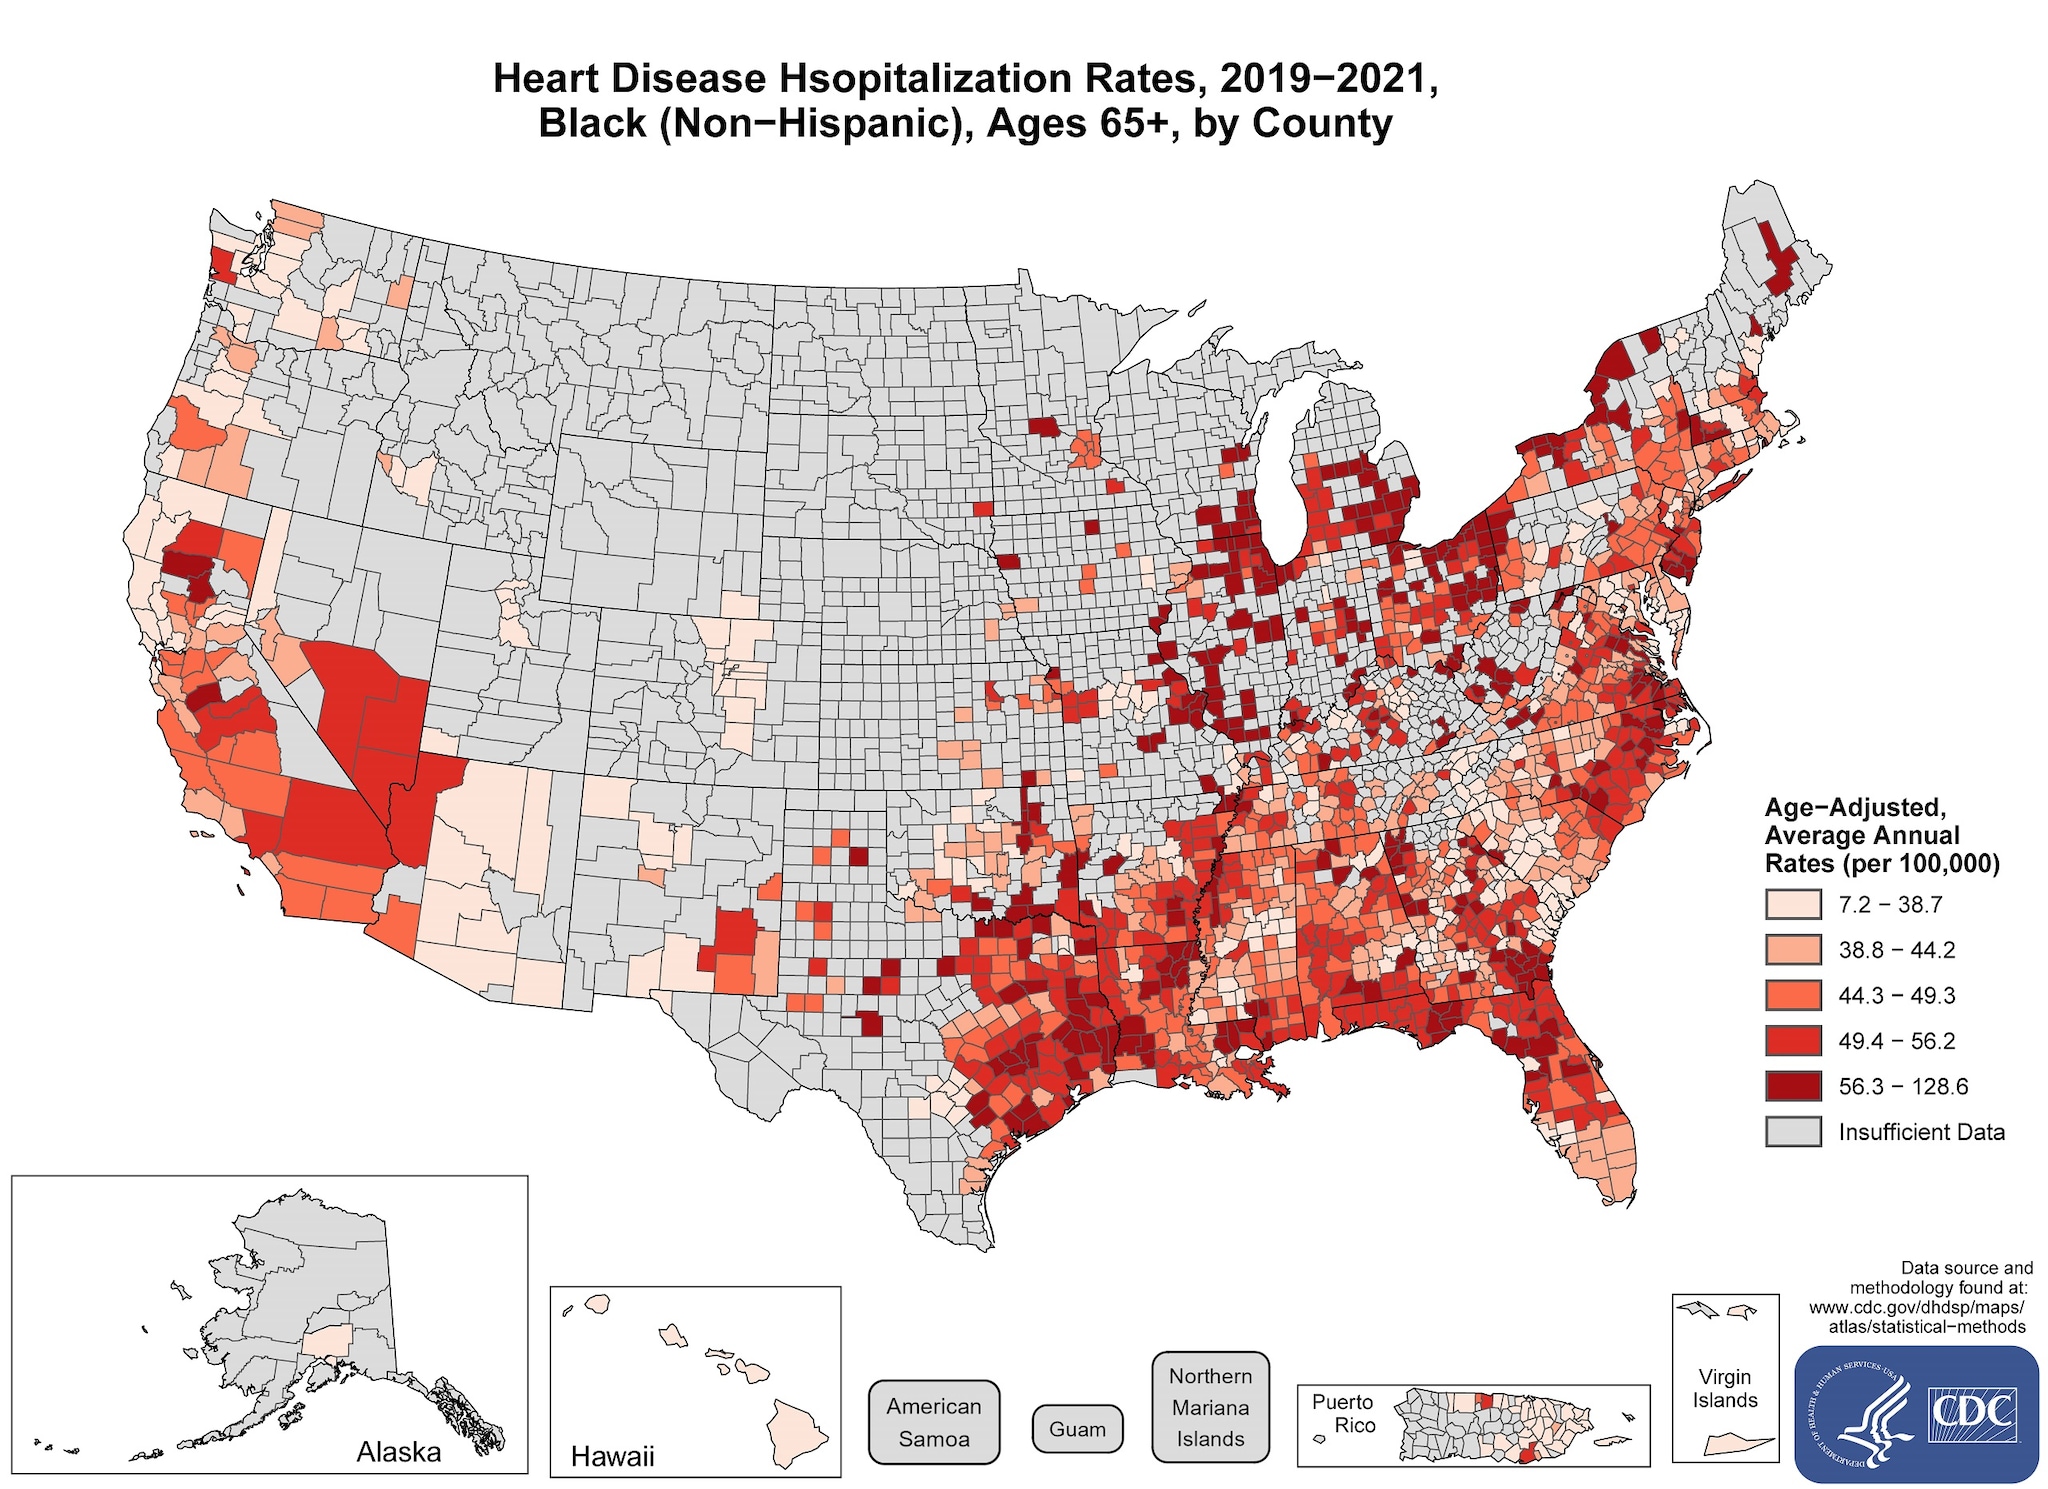
View the text description of this map.
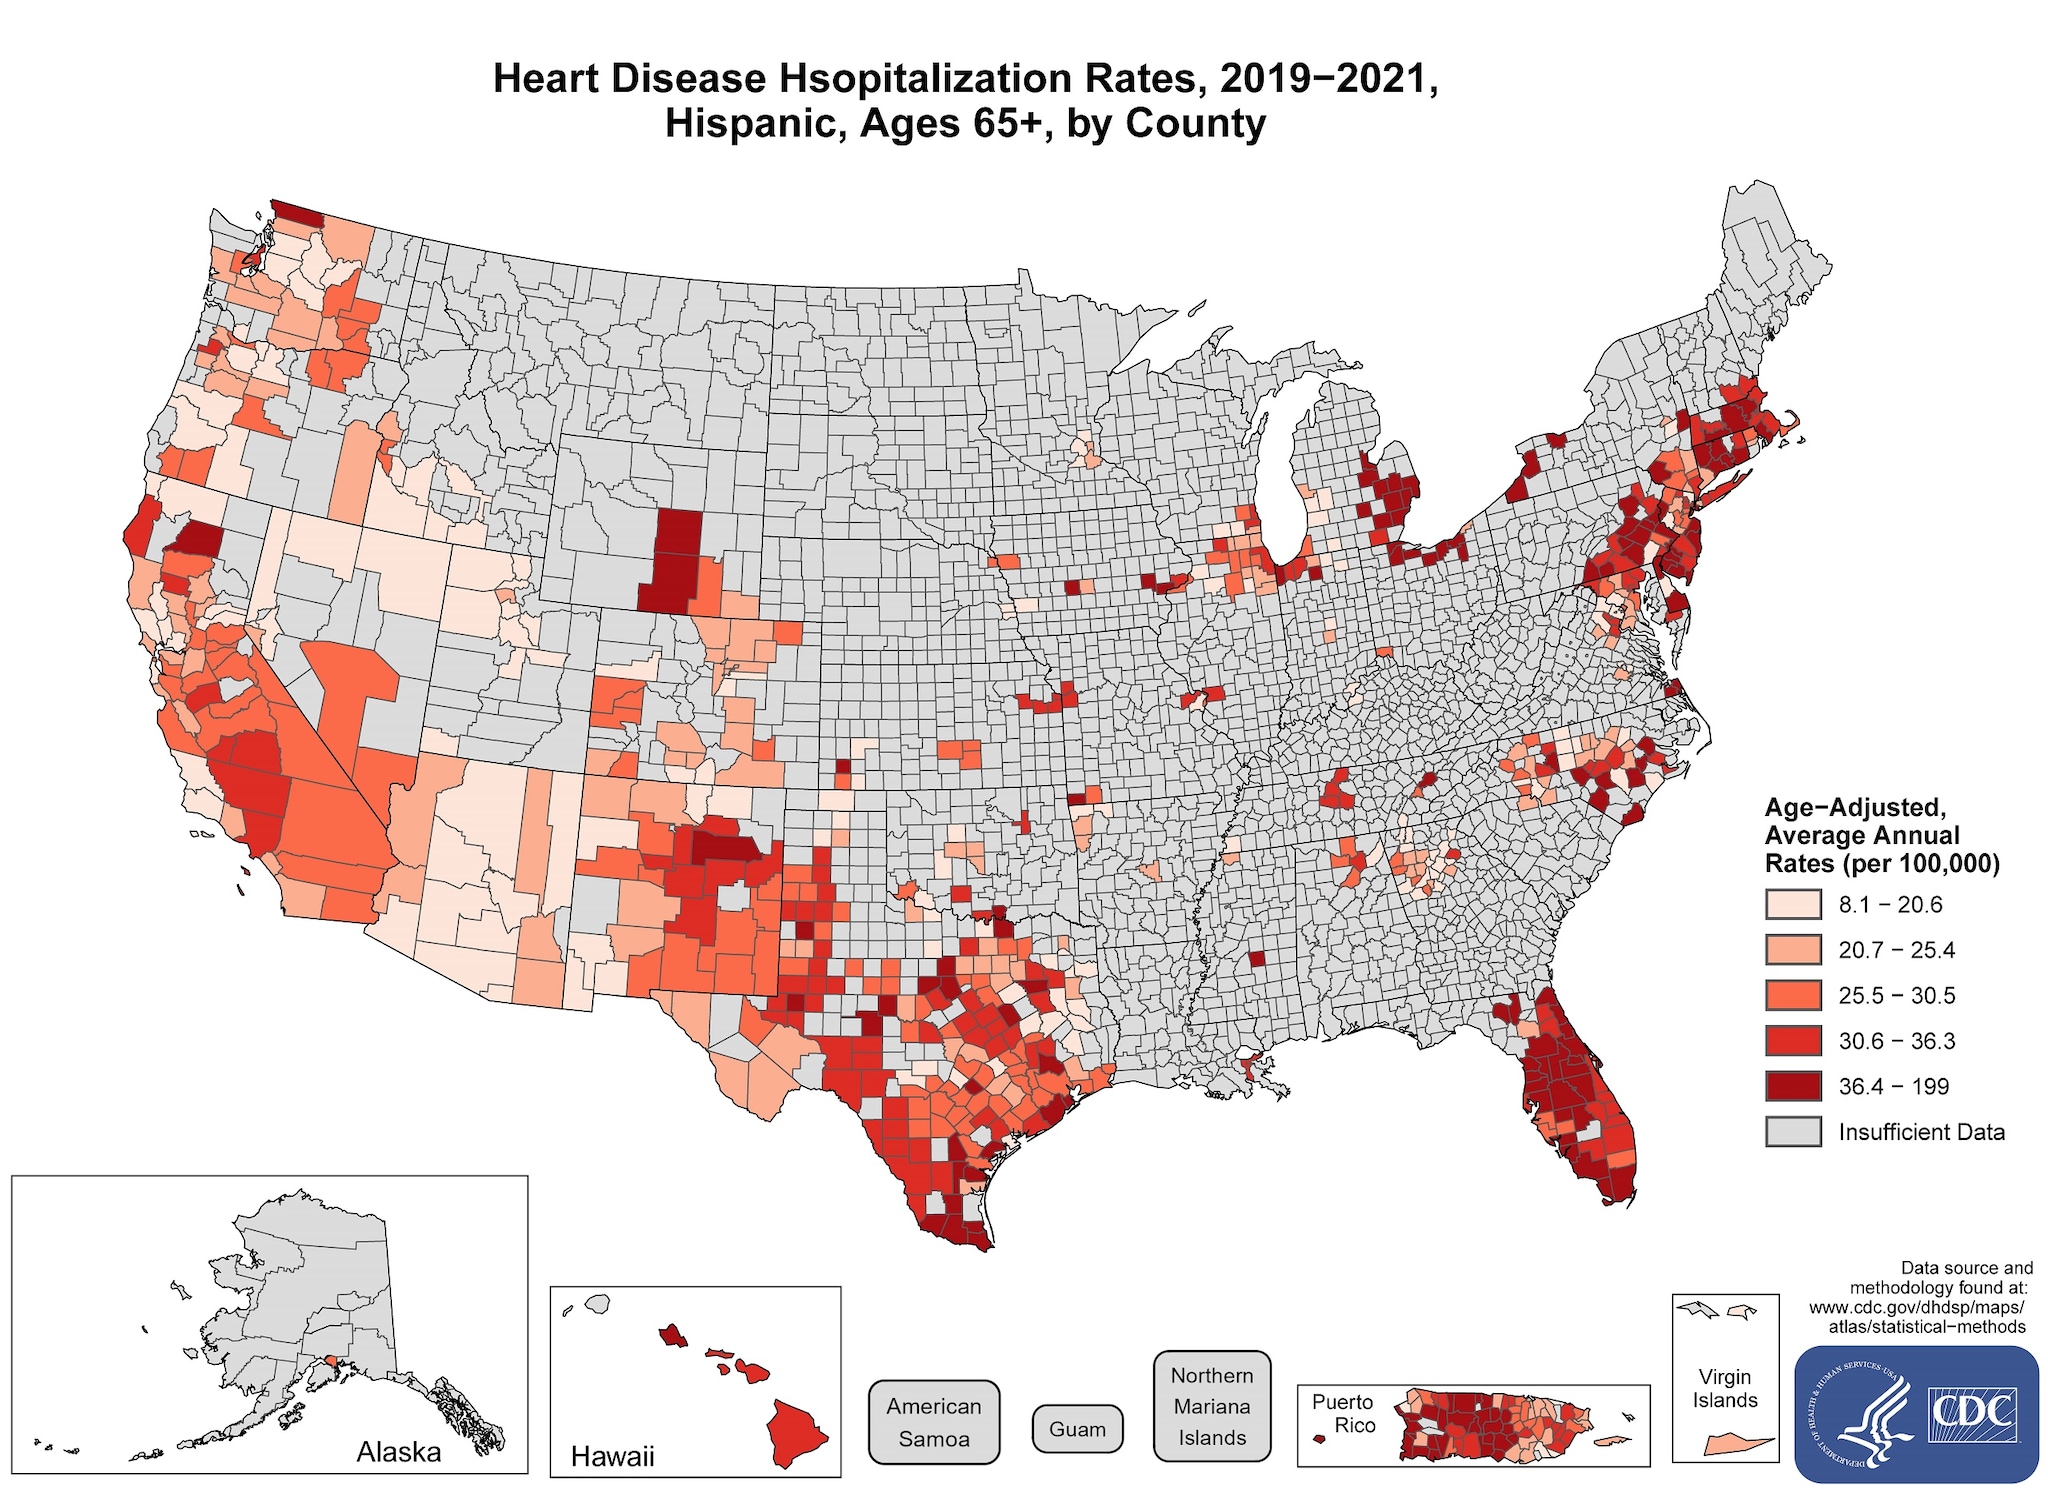
View the text description of this map.
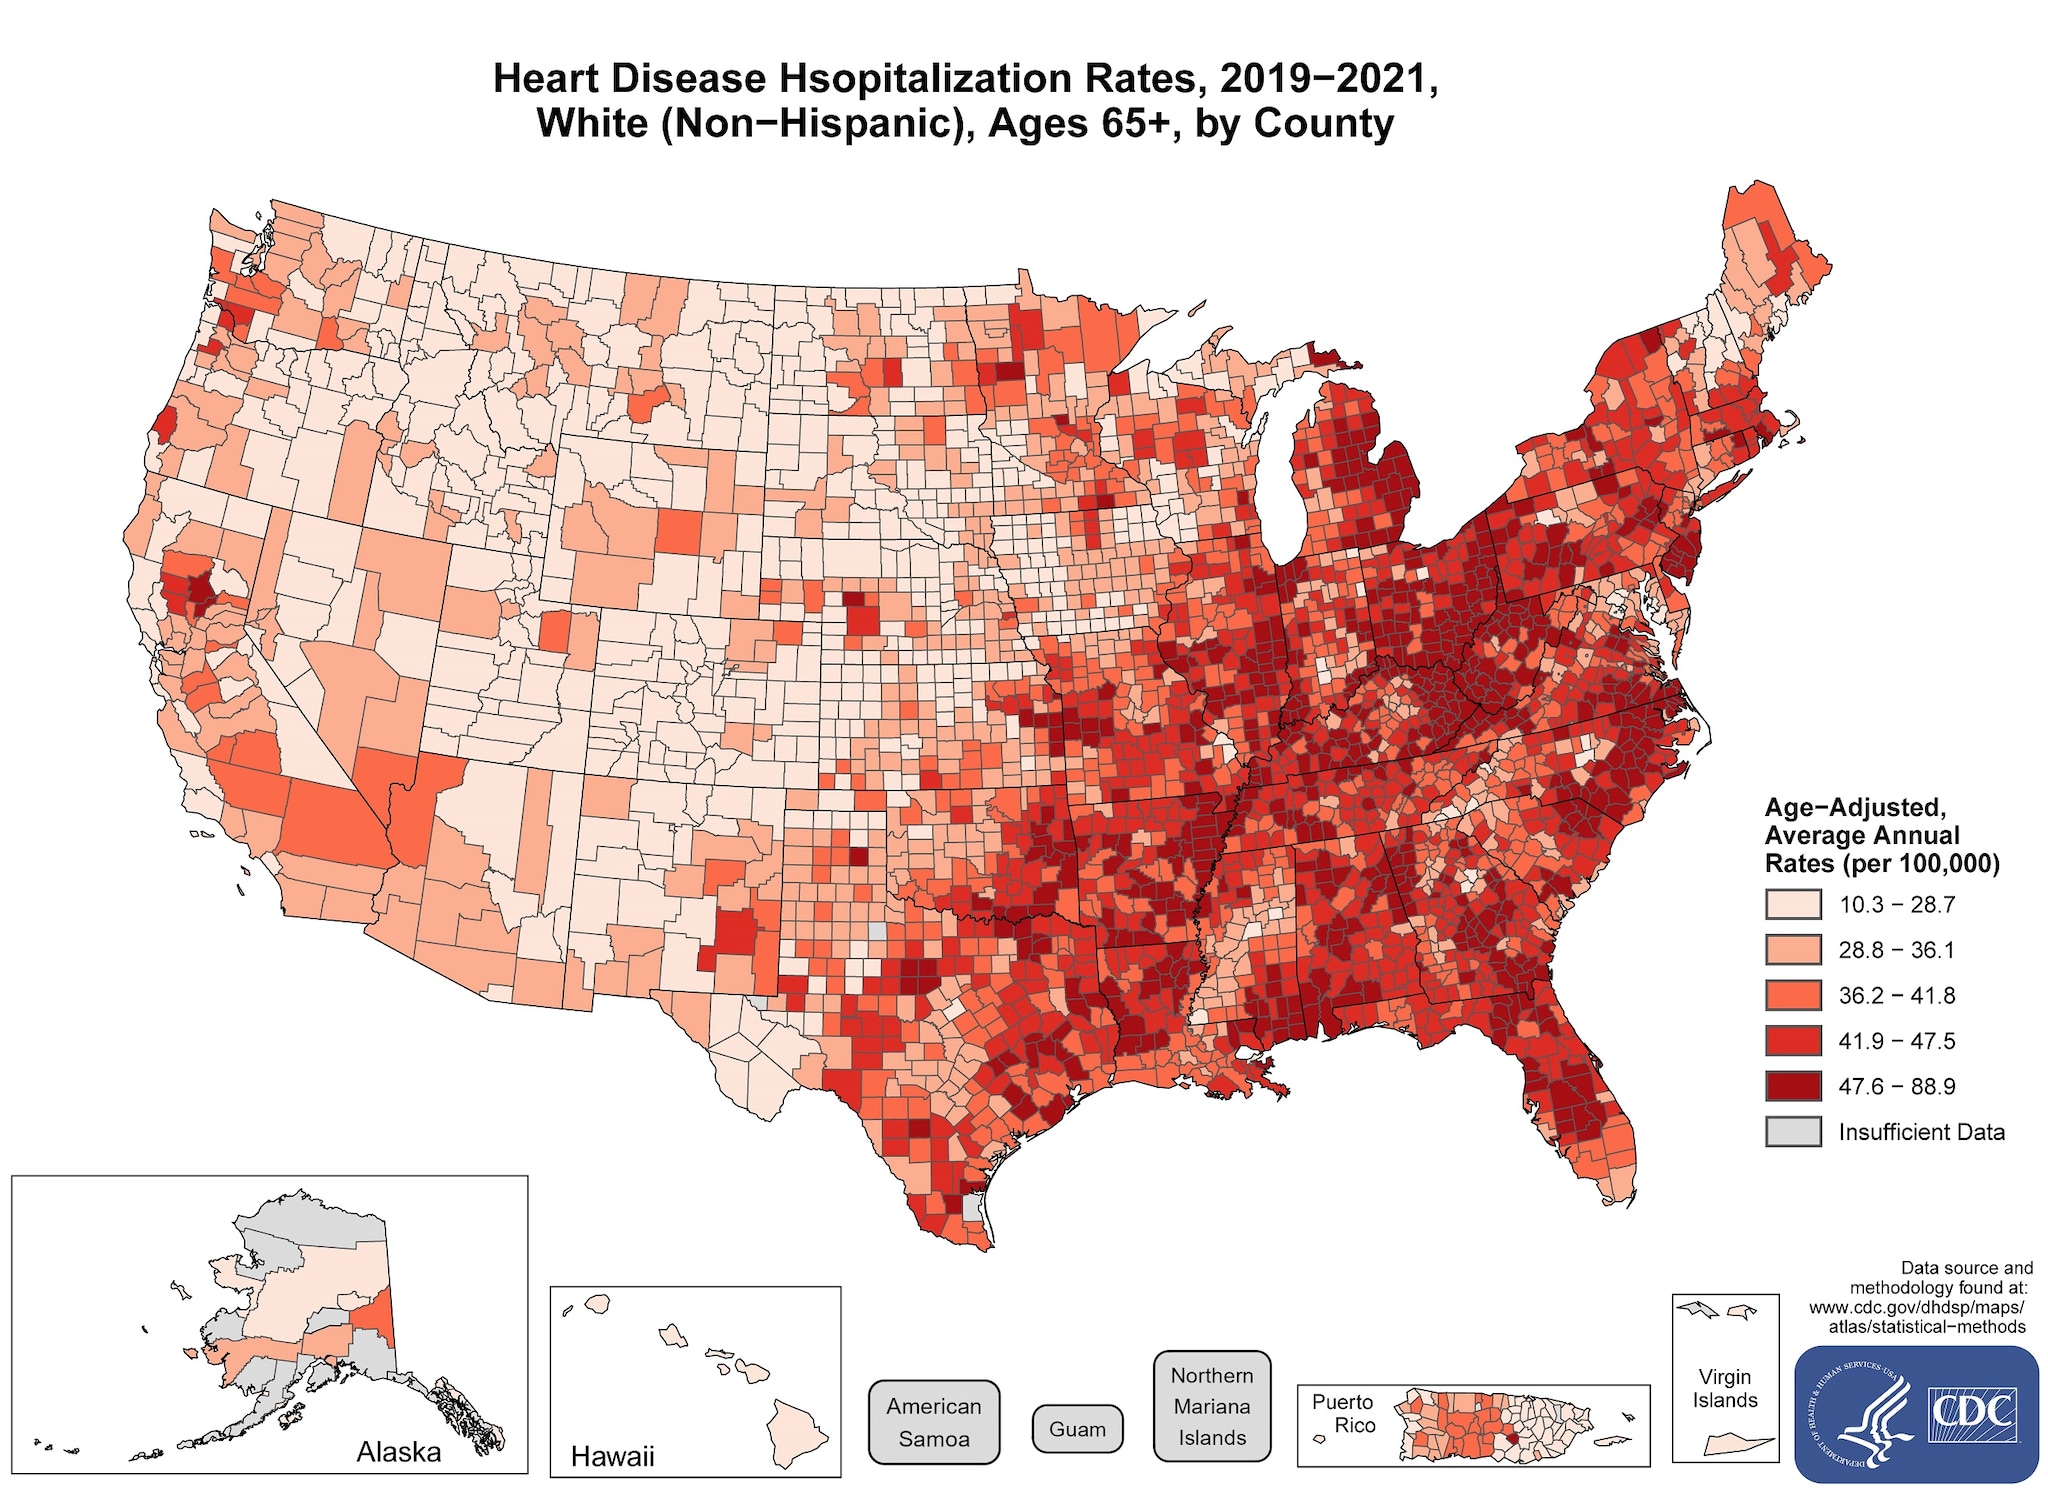
View the text description of this map.
Stroke death rates
Maps show death rates by county for the United States and US territories.
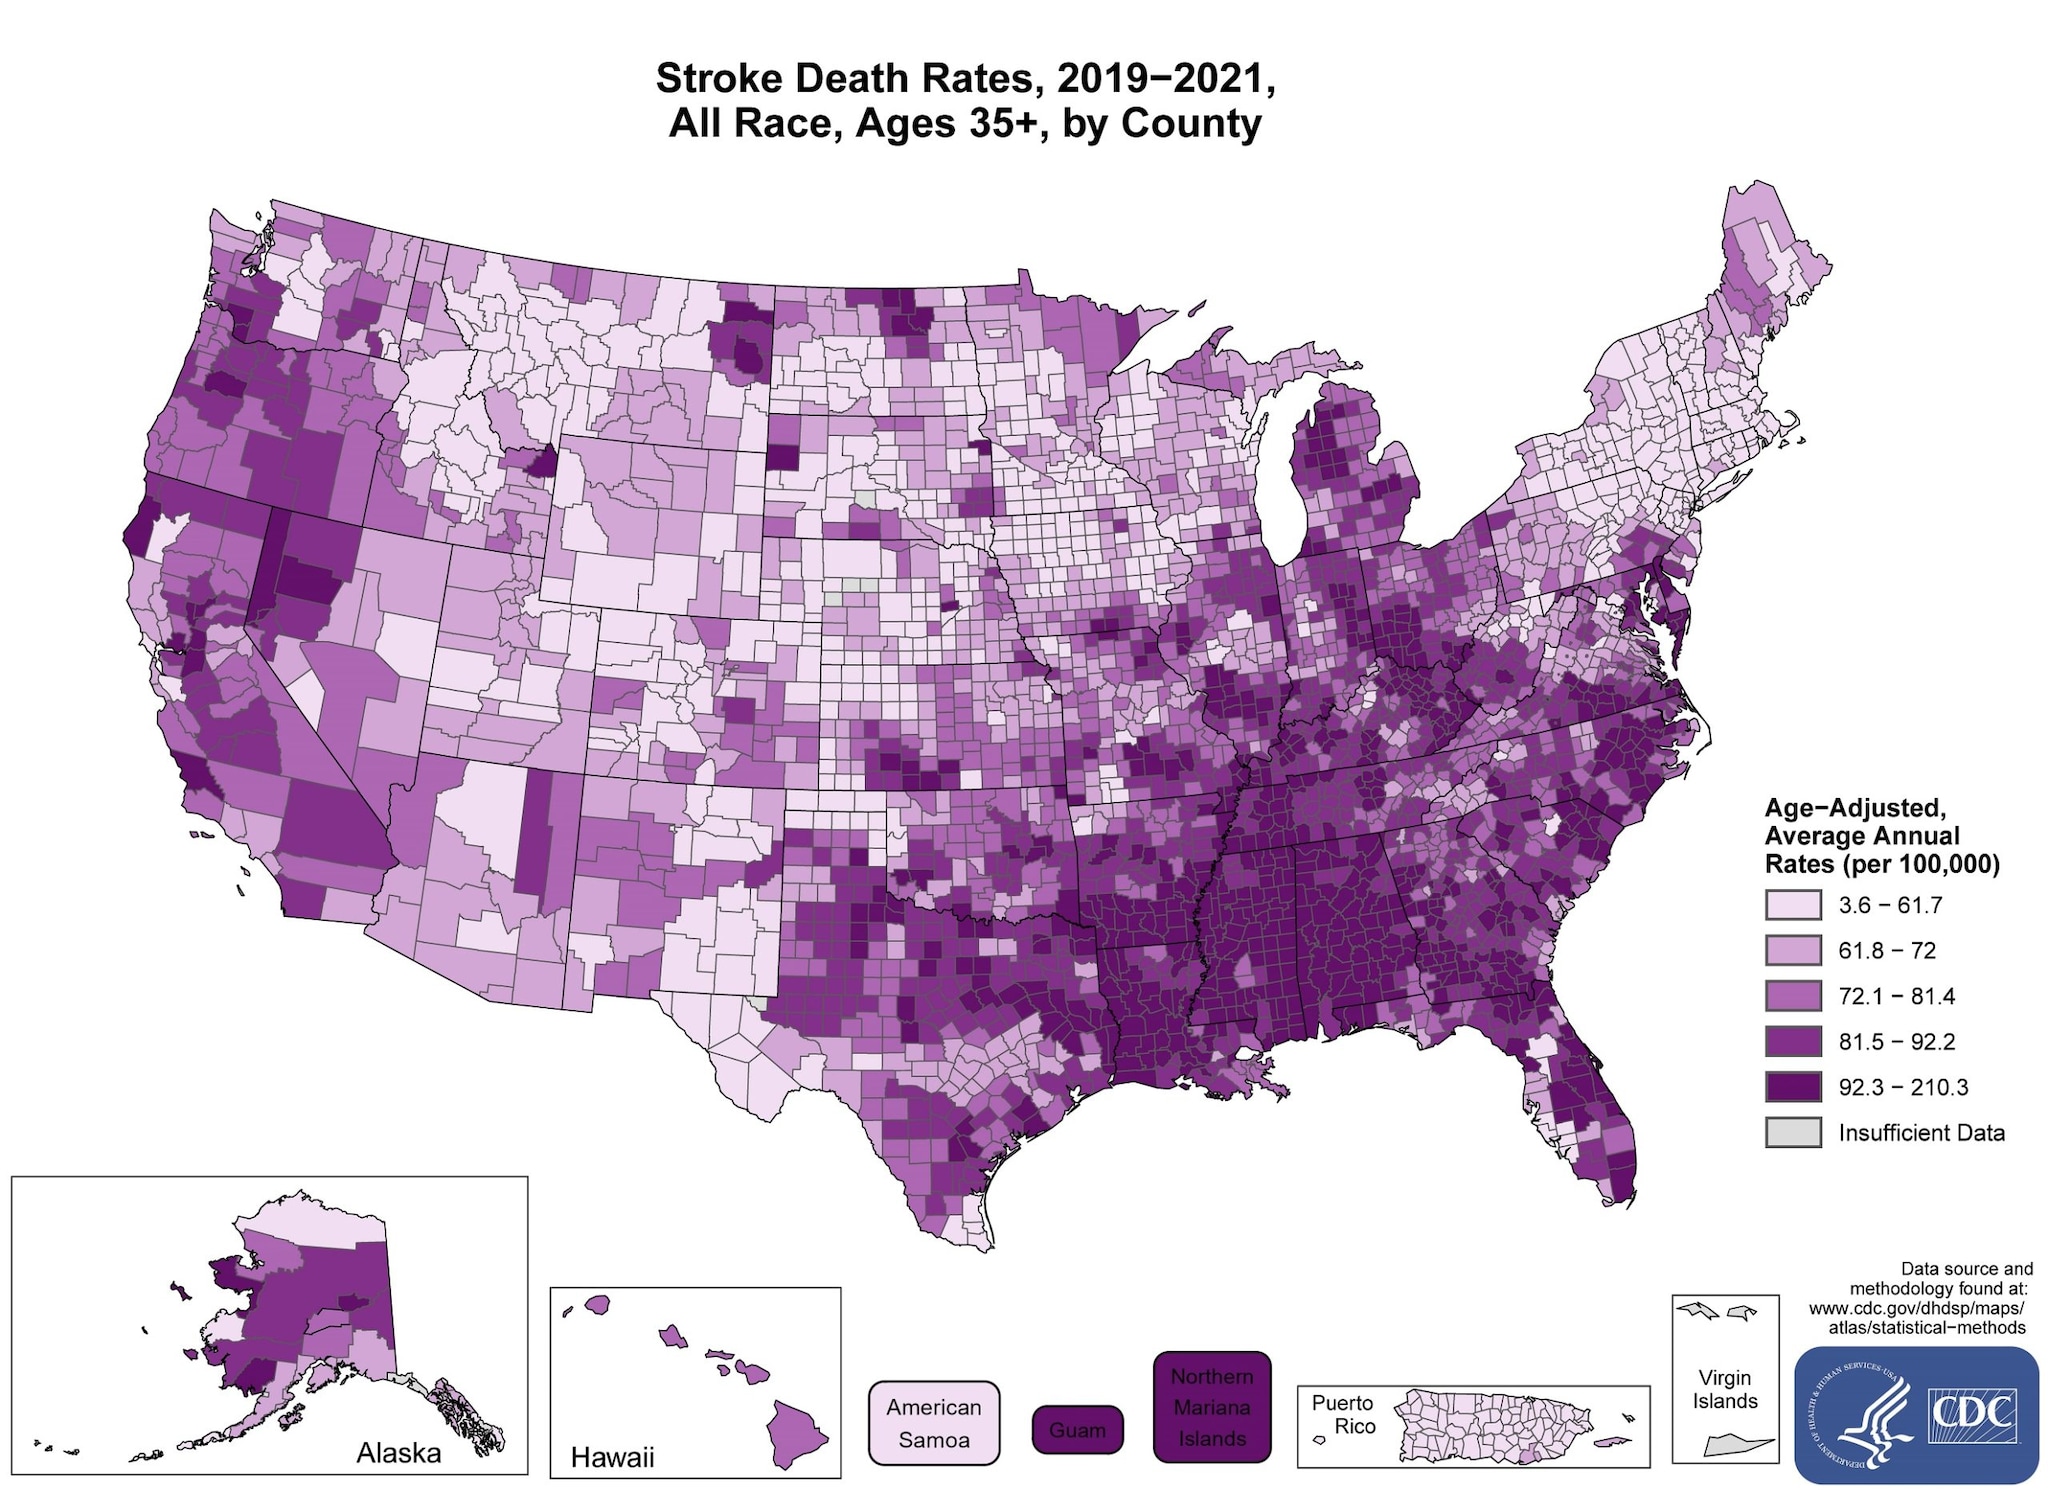
View the text description of this map.
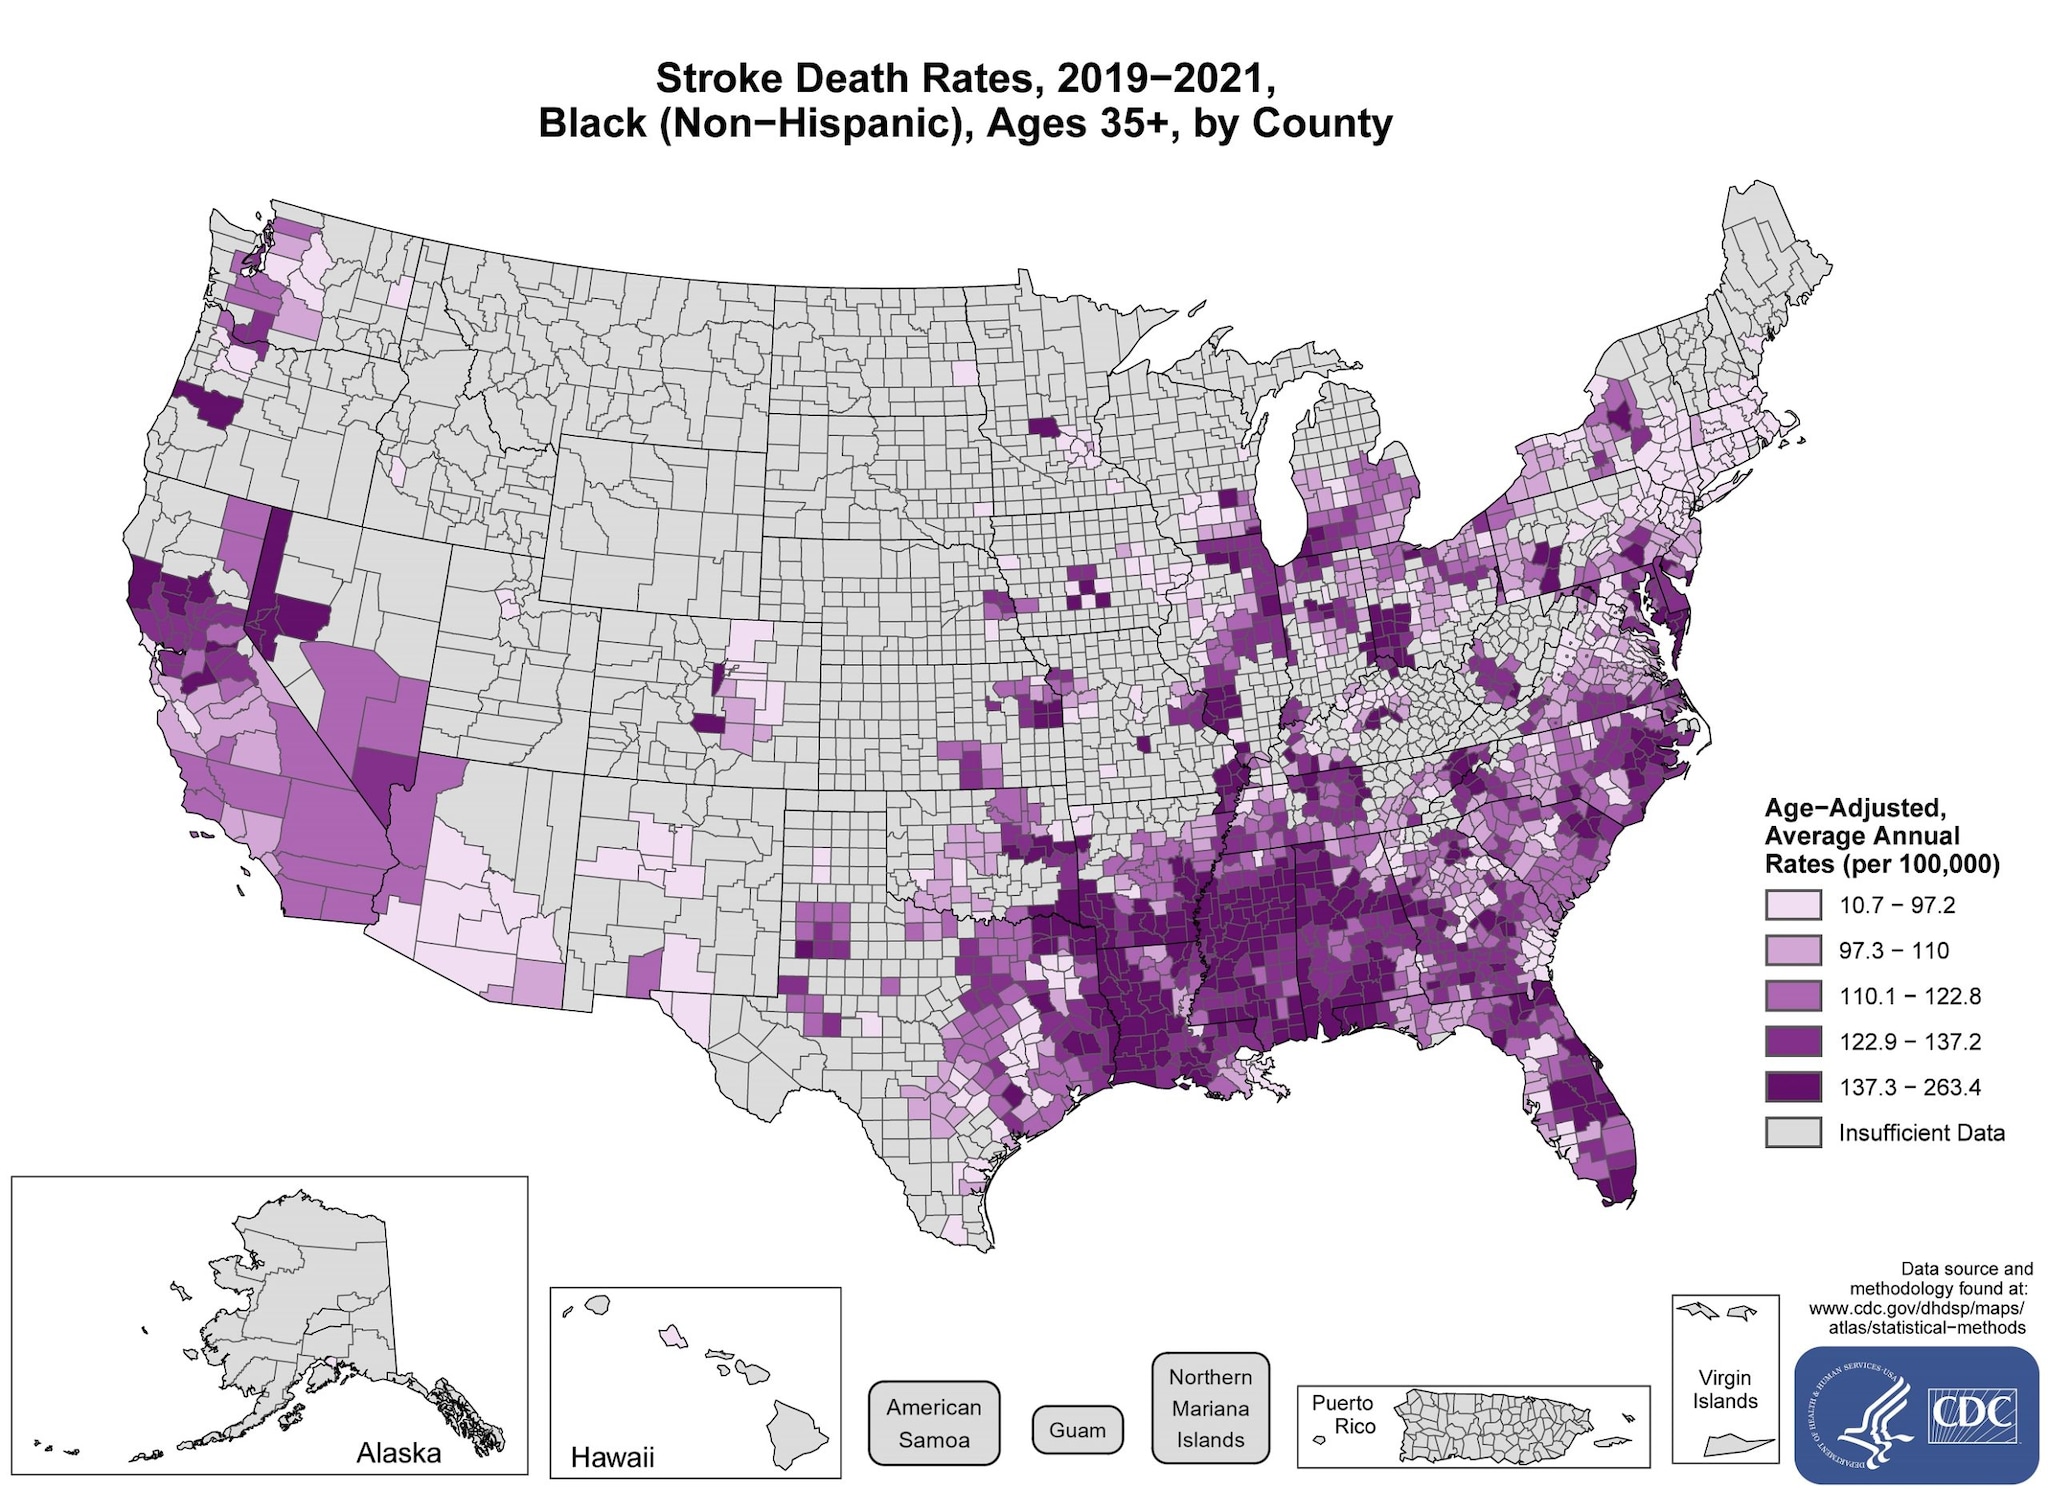
View the text description of this map.
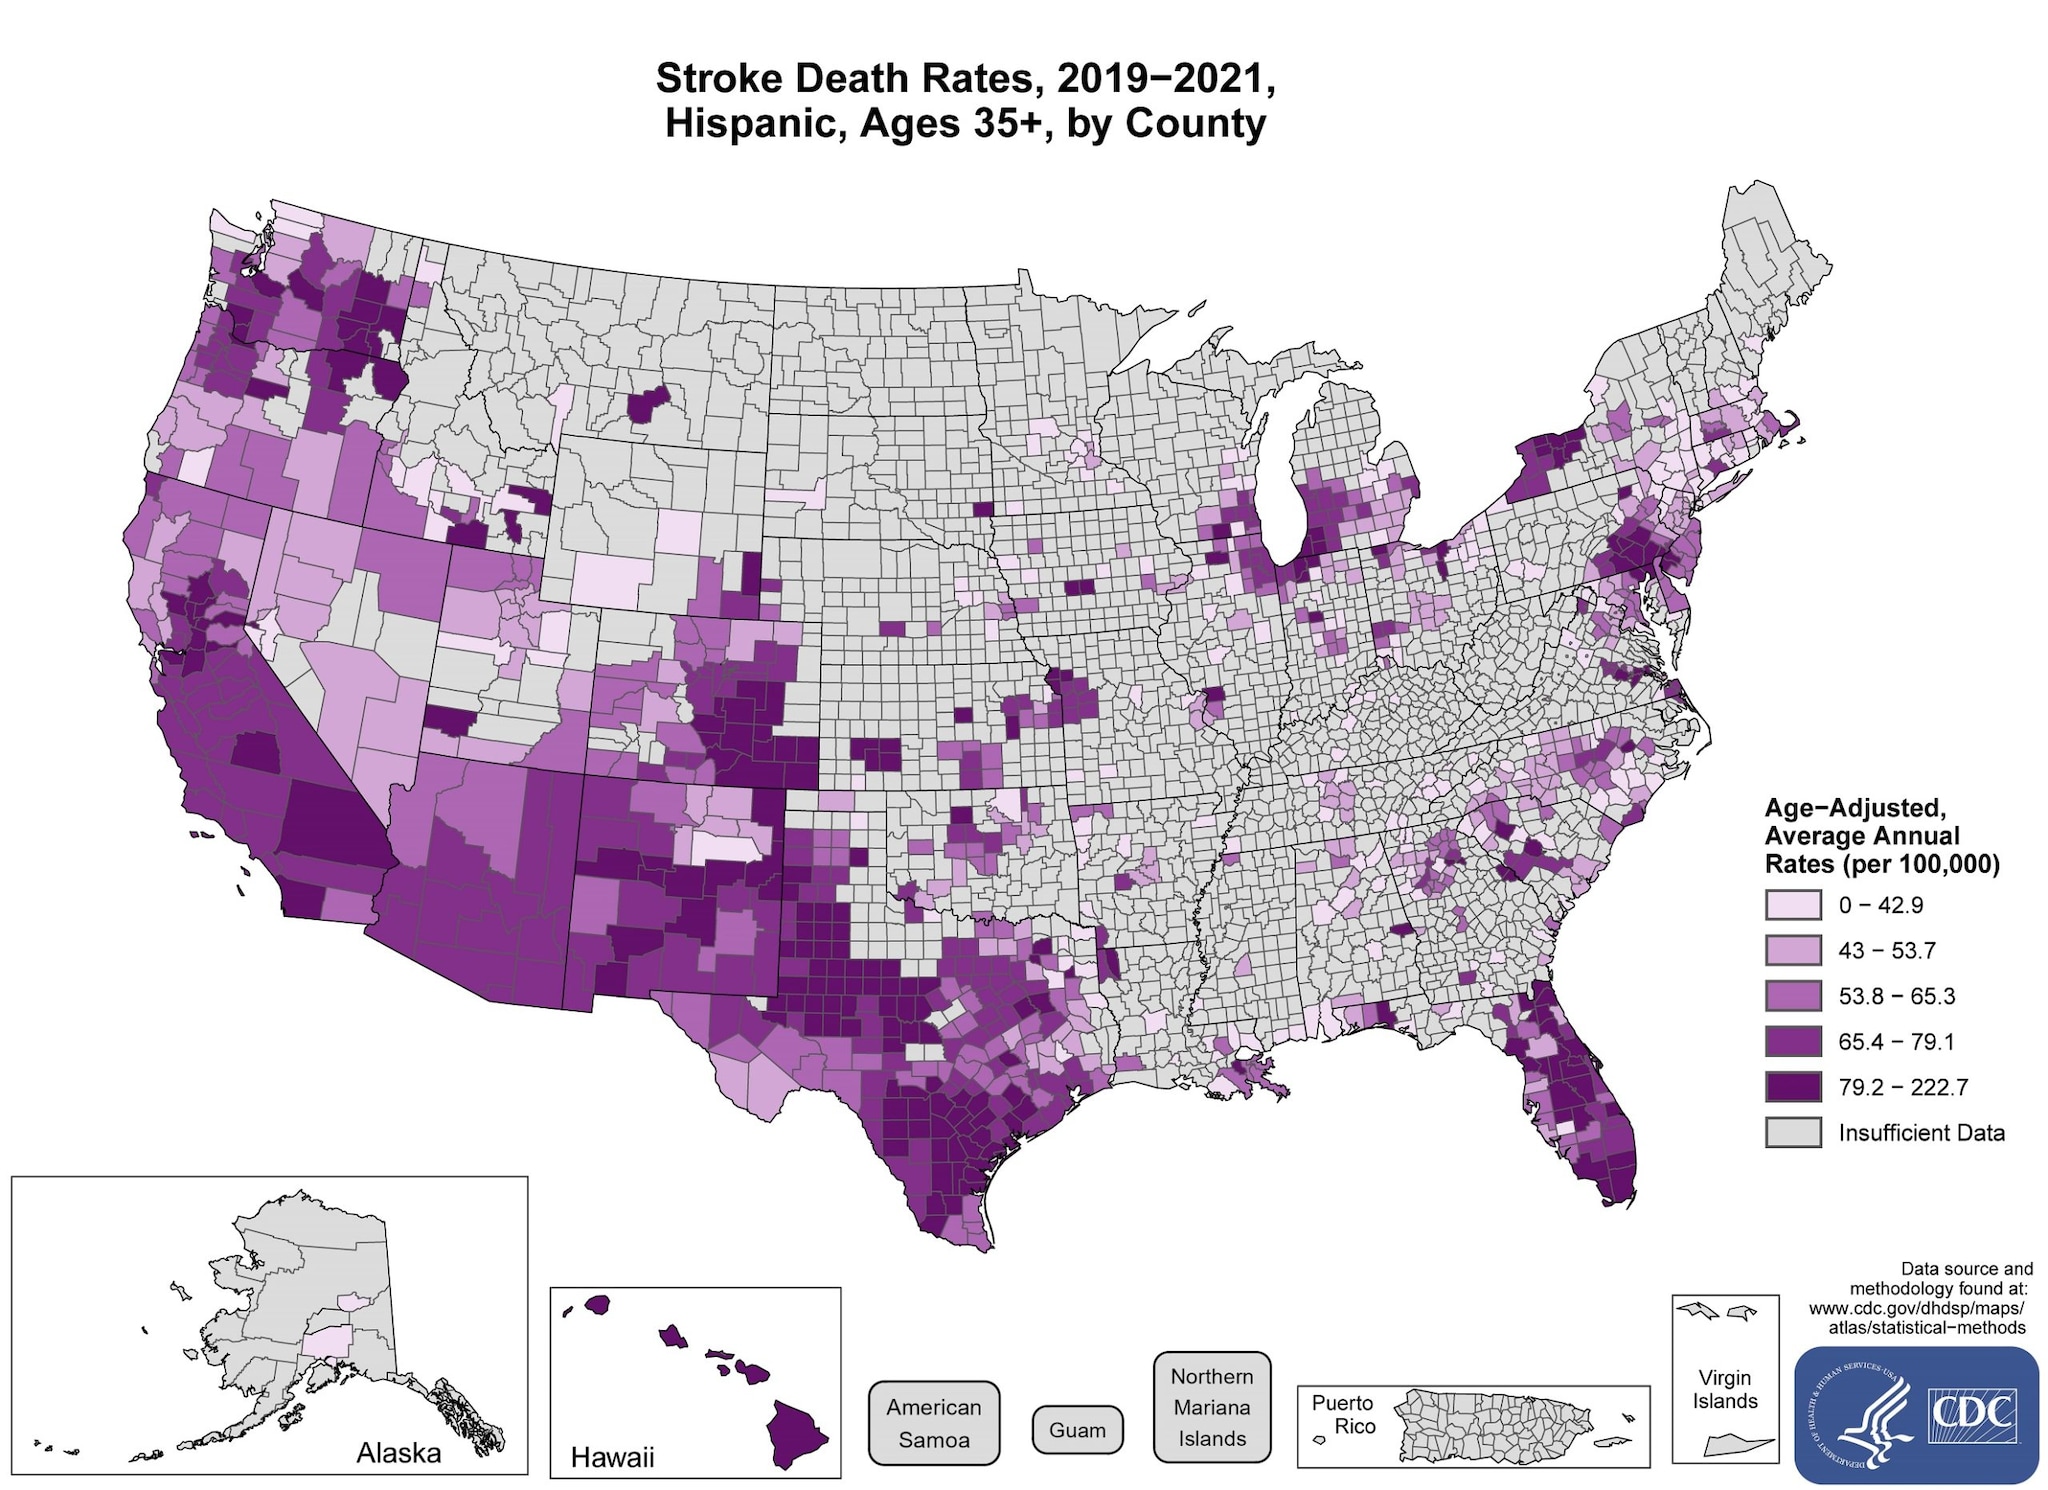
View the text description of this map.
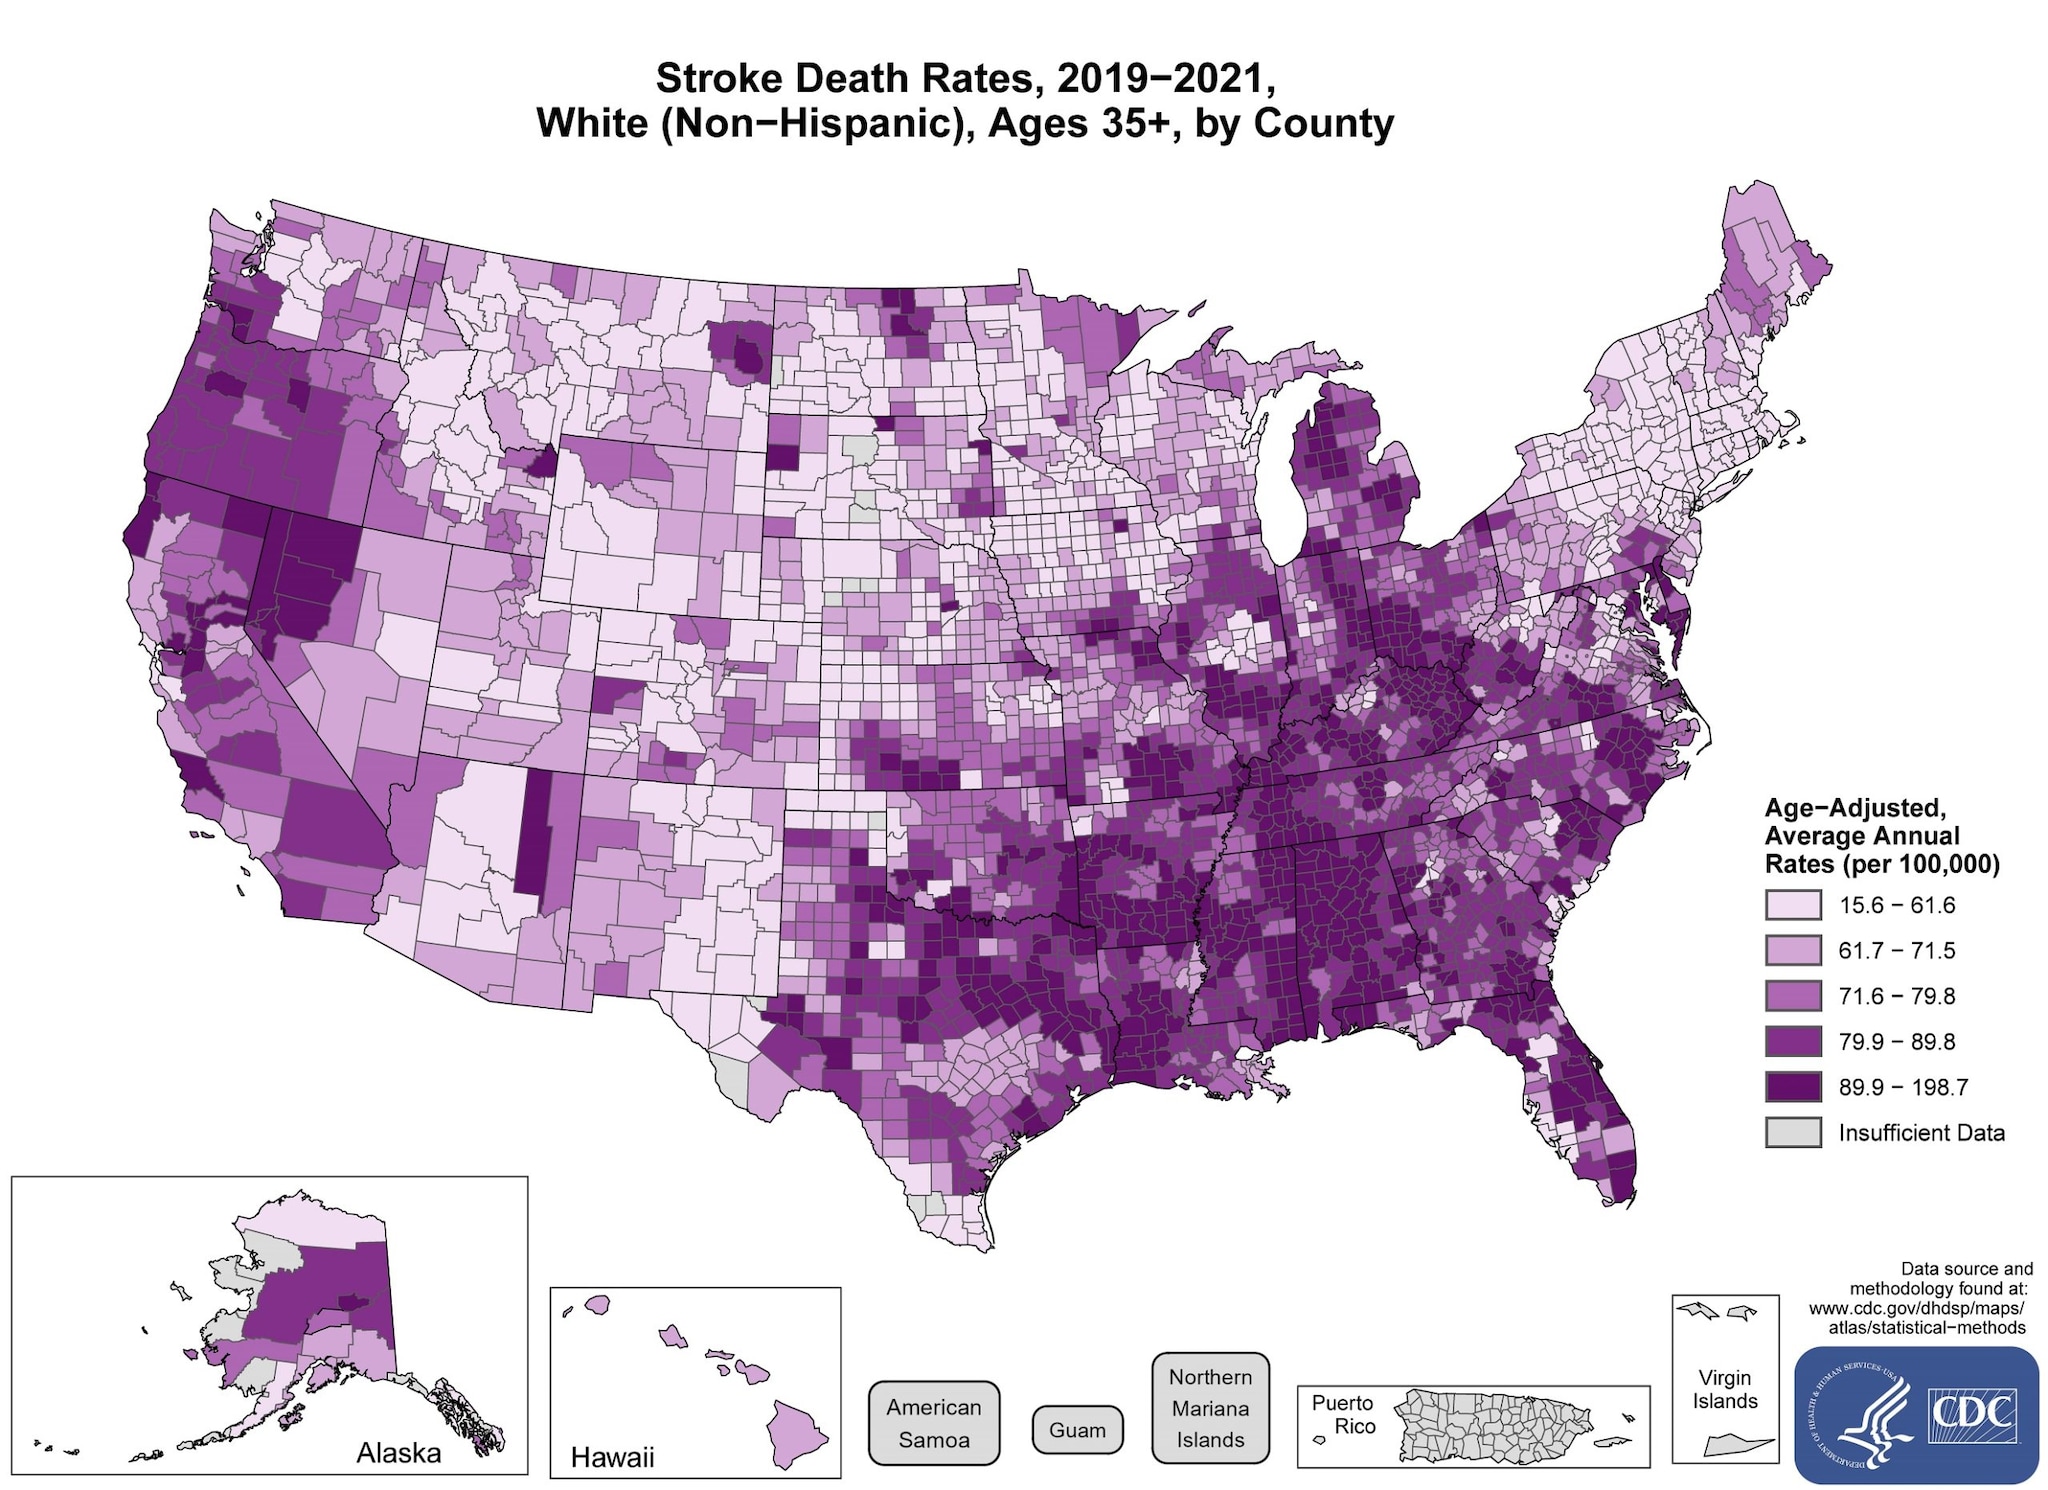
View the text description of this map.
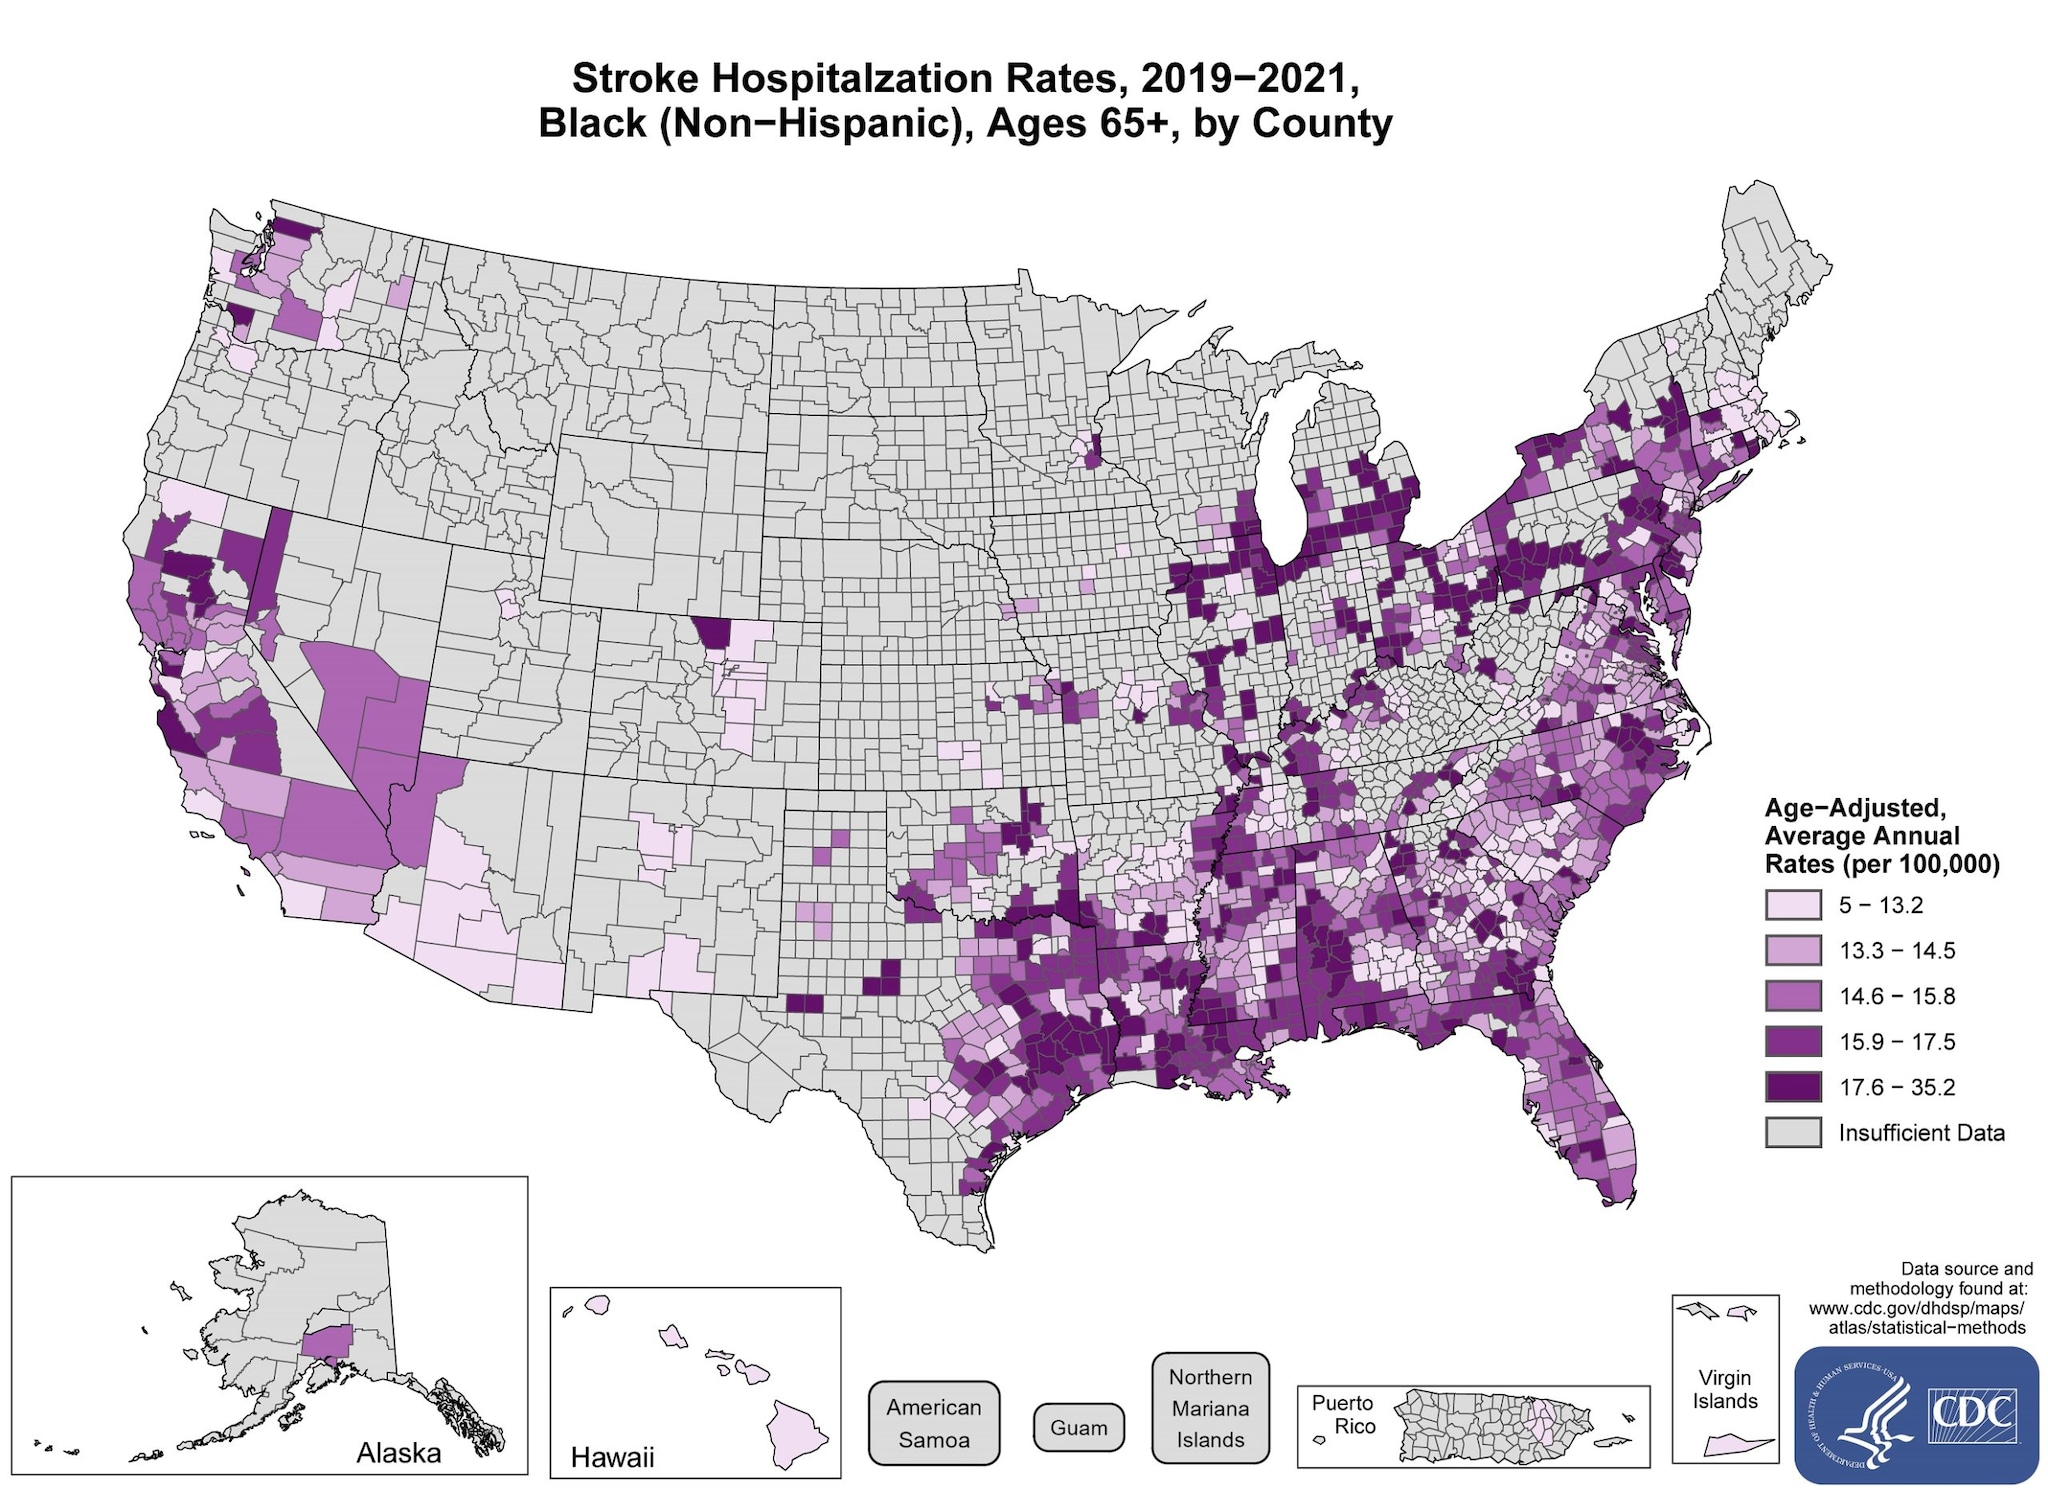
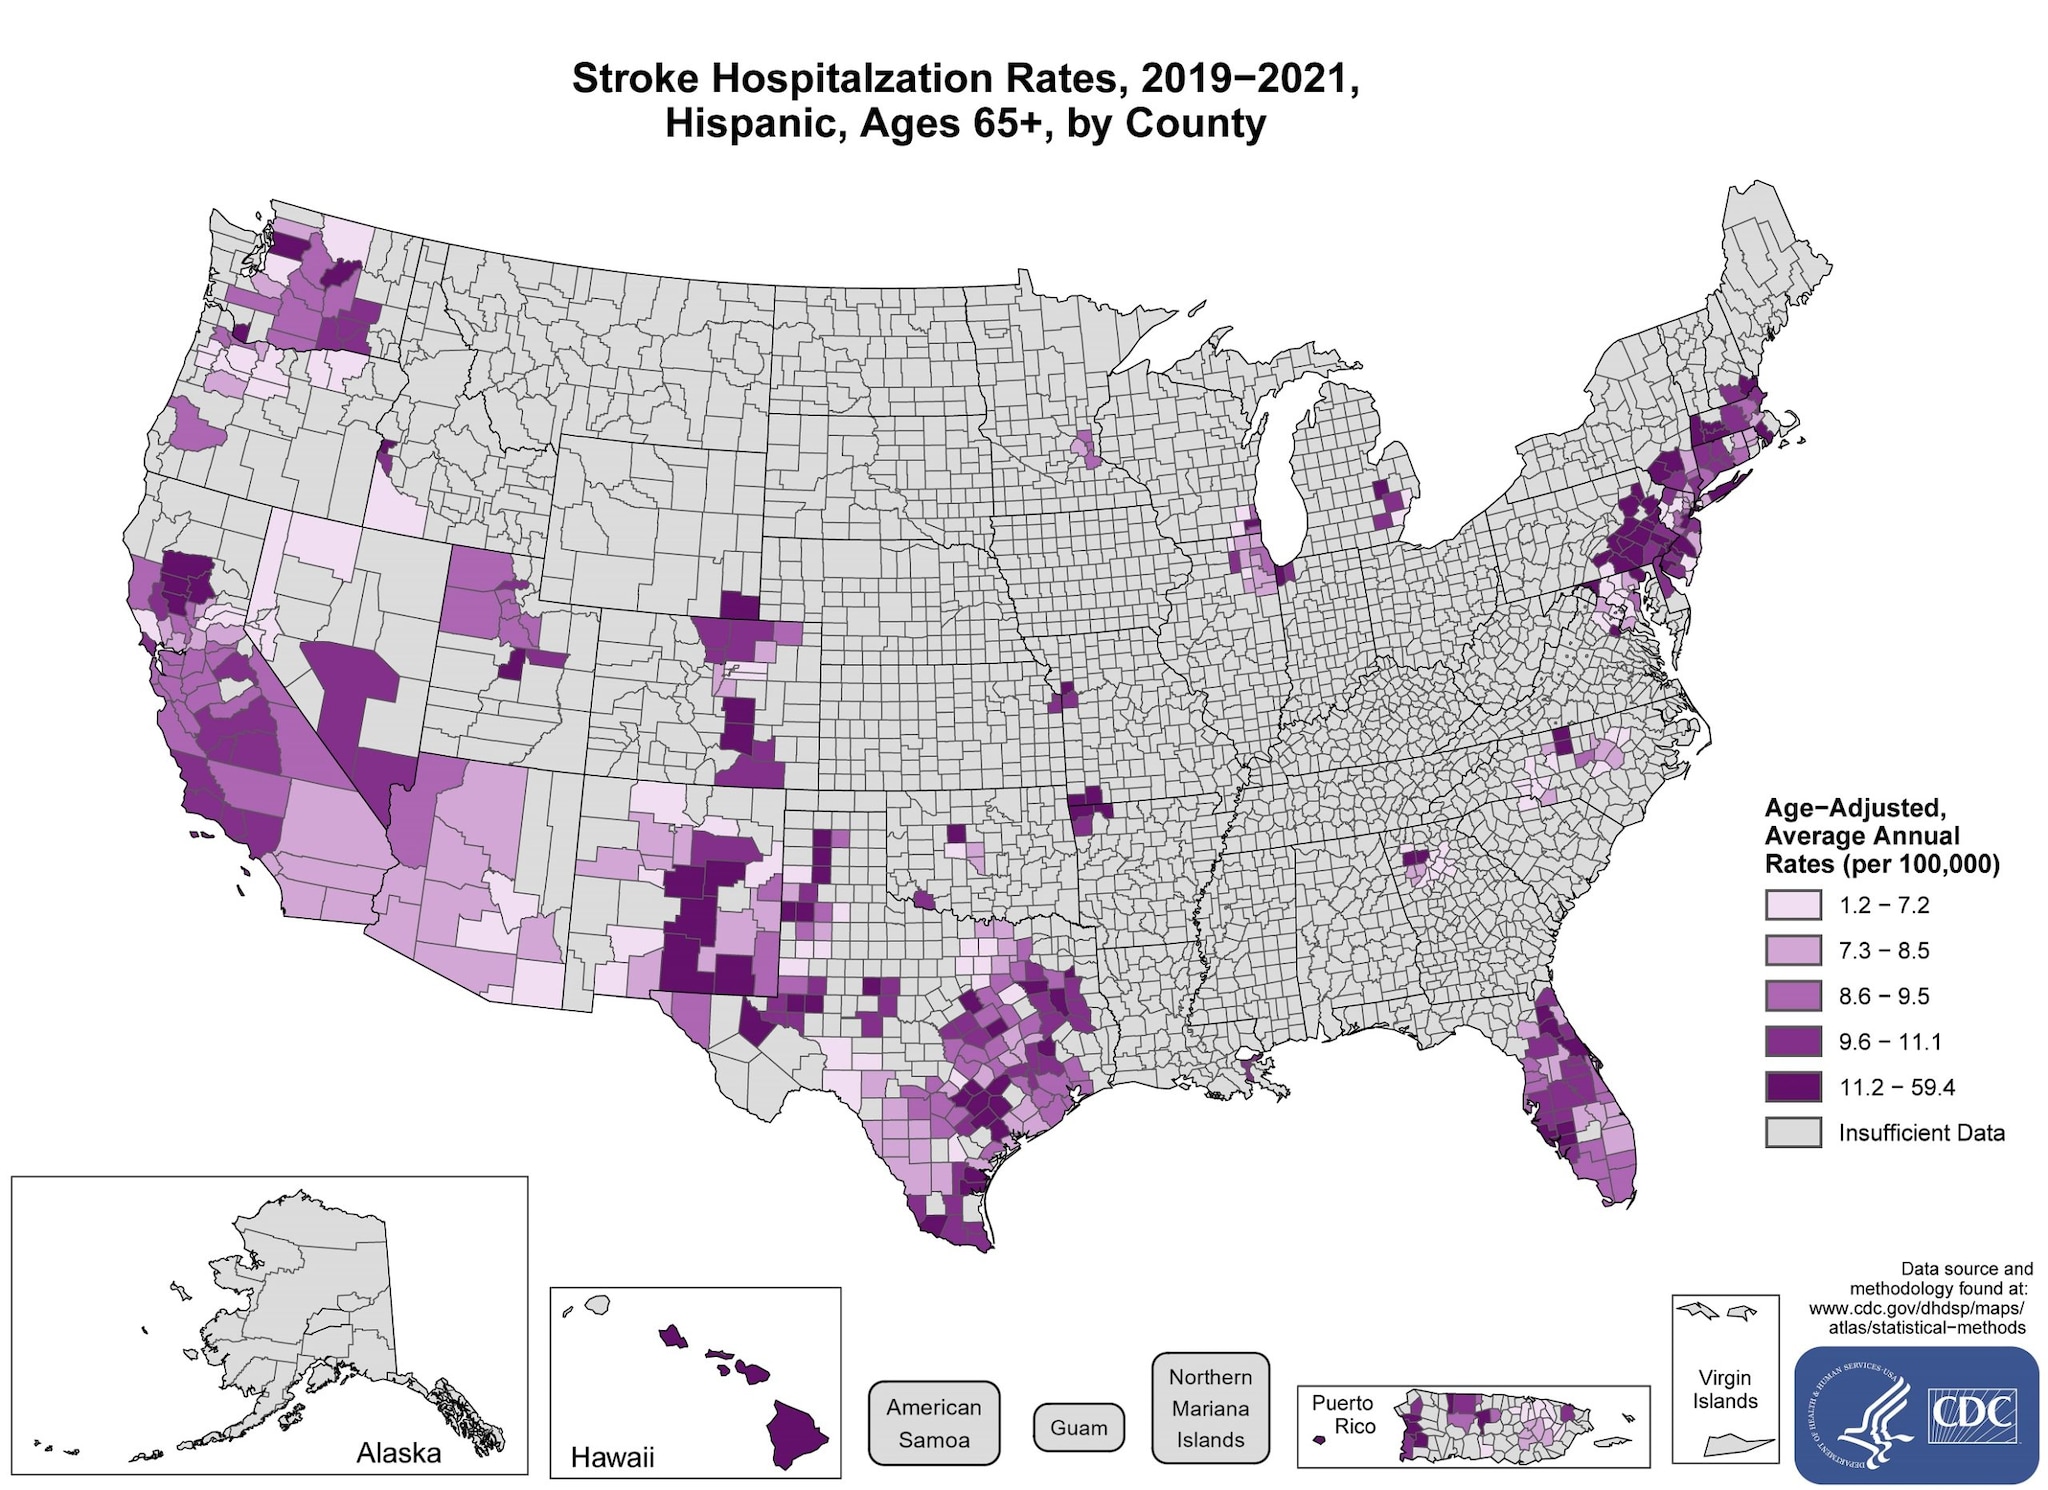
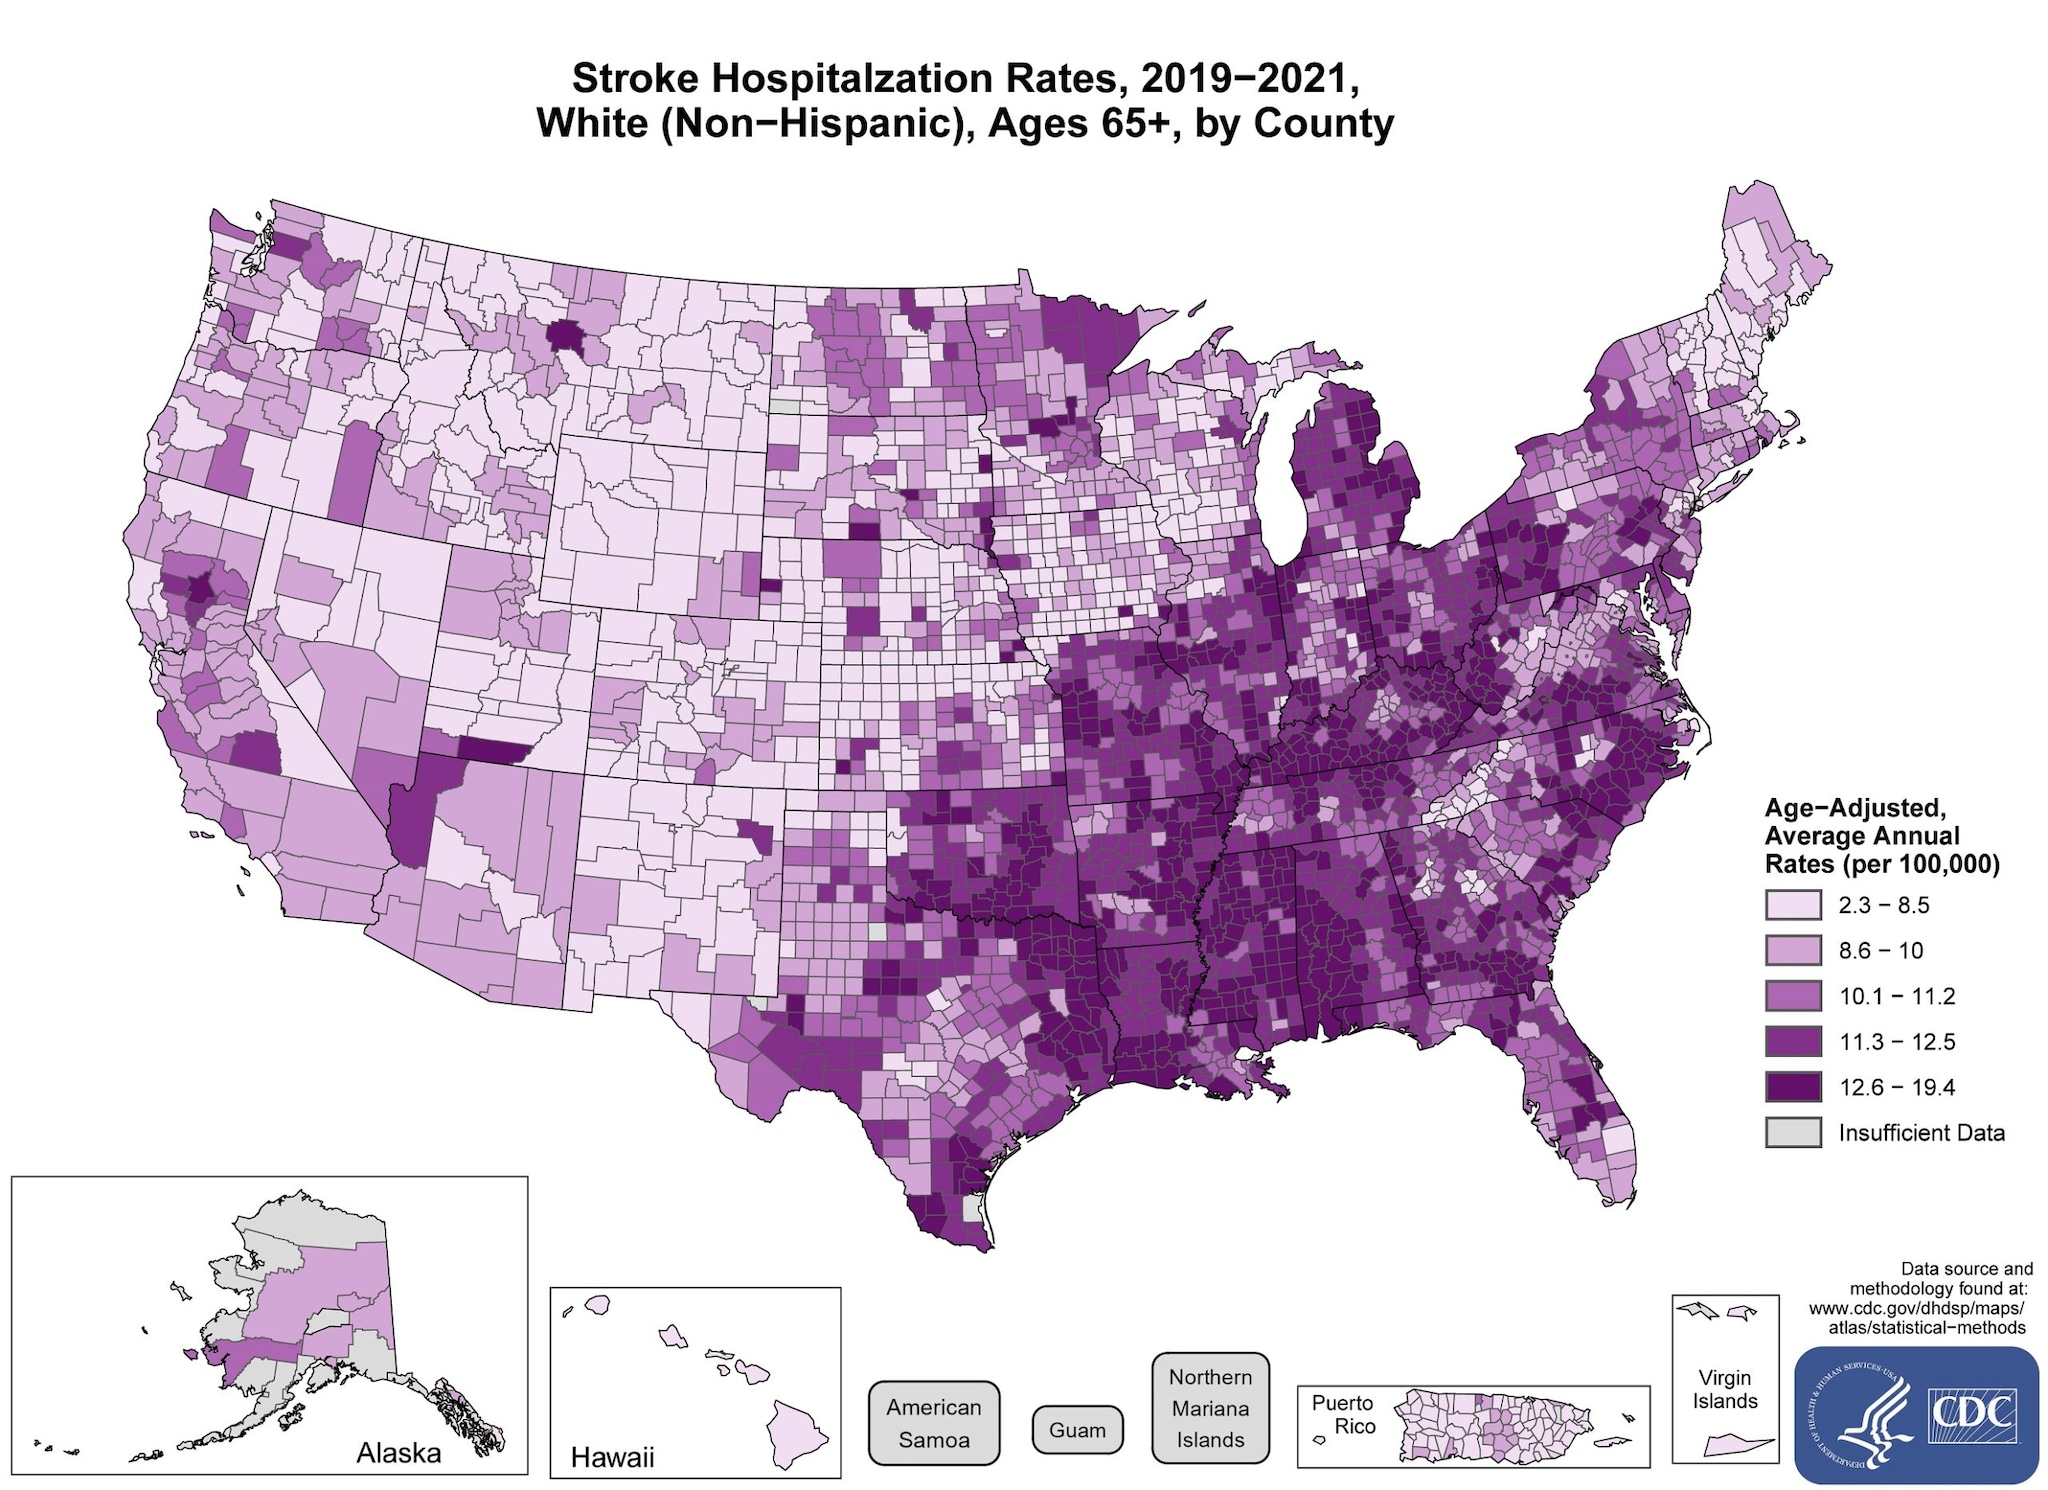
Stroke hospitalization rates
Maps show death rates by county for the United States and US territories.

View the text description of this map.
View the text description of this map.
View the text description of this map.
View the text description of this map.