Key points
Data sources
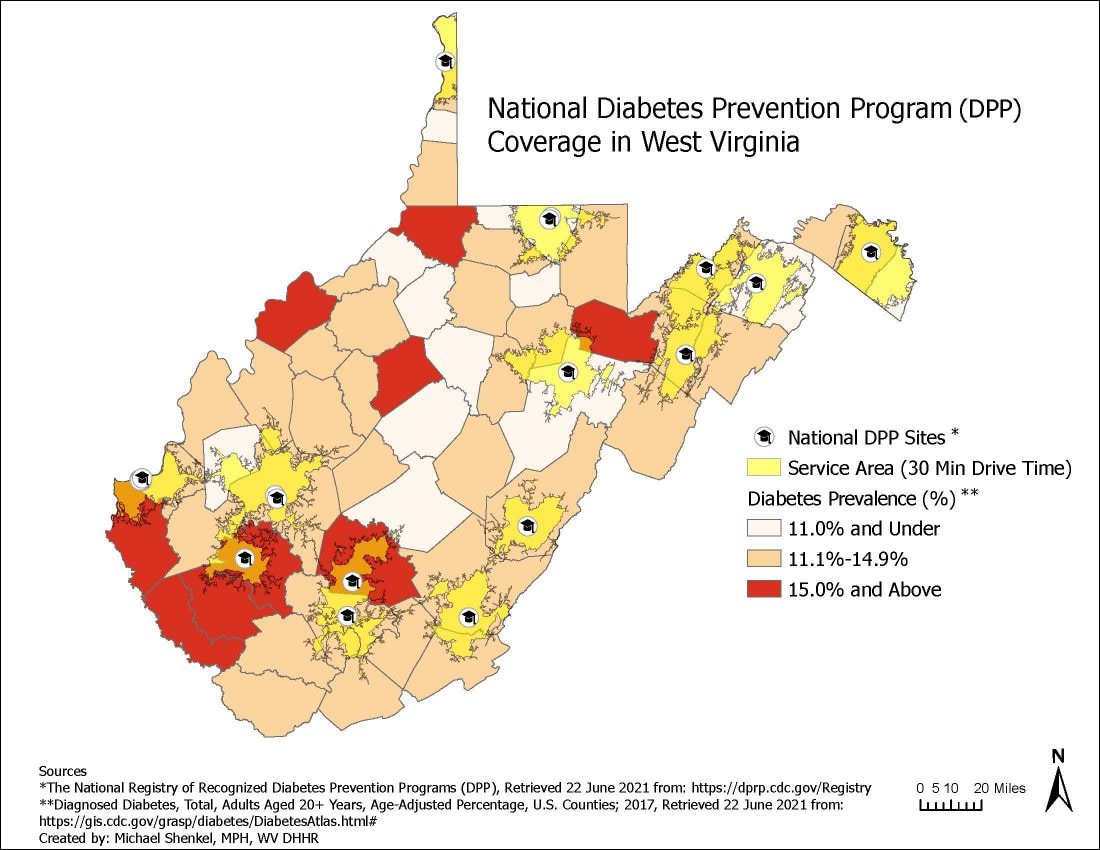
There is a need for additional National Diabetes Prevention This map shows that residents in many of the counties with the highest prevalence of diabetes do not live within 30 minutes of a National Diabetes Prevention Program. This leaves many people without access to diabetes preventative classes at a time when West Virginia is suffering from some of the highest diabetes prevalence in the nation.
ArcGIS Pro
The National Registry of Recognized Diabetes Prevention Programs, Accessed 22 June.
Diagnosed Diabetes, Total, Adults Aged 20+ Years, Age-Adjusted Percentage, U.S. Counties, 2017, GRASP, CDC. Accessed June 22, 2021.
This map uses cartographic and statistical information. Local Drive time was established at 30 minutes because of how many rural areas are in the state. Age-adjusted diabetes percentage rates were taken from the CDC Diabetes
Diabetes rates were categorized by quintile. The middle three categories were combined to highlight the counties with the lowest and highest diabetes rates.
This map will be used to identify areas of greatest need for National Diabetes Prevention Programs. It will also enable the Bureau for Public Health to target high need areas without existing program coverage for intervention.
Michael Shenkel, West Virginia State Department of Health. Accessed from the Centers for Disease Control and Prevention’s Chronic Disease GIS Exchange https://www.cdc.gov/dhdsp/maps/gisx/mapgallery/WV_DPPSites.html Accessed from the Centers for Disease Control and Prevention's Chronic Disease Map Gallery.

