At a glance
Map
Data sources
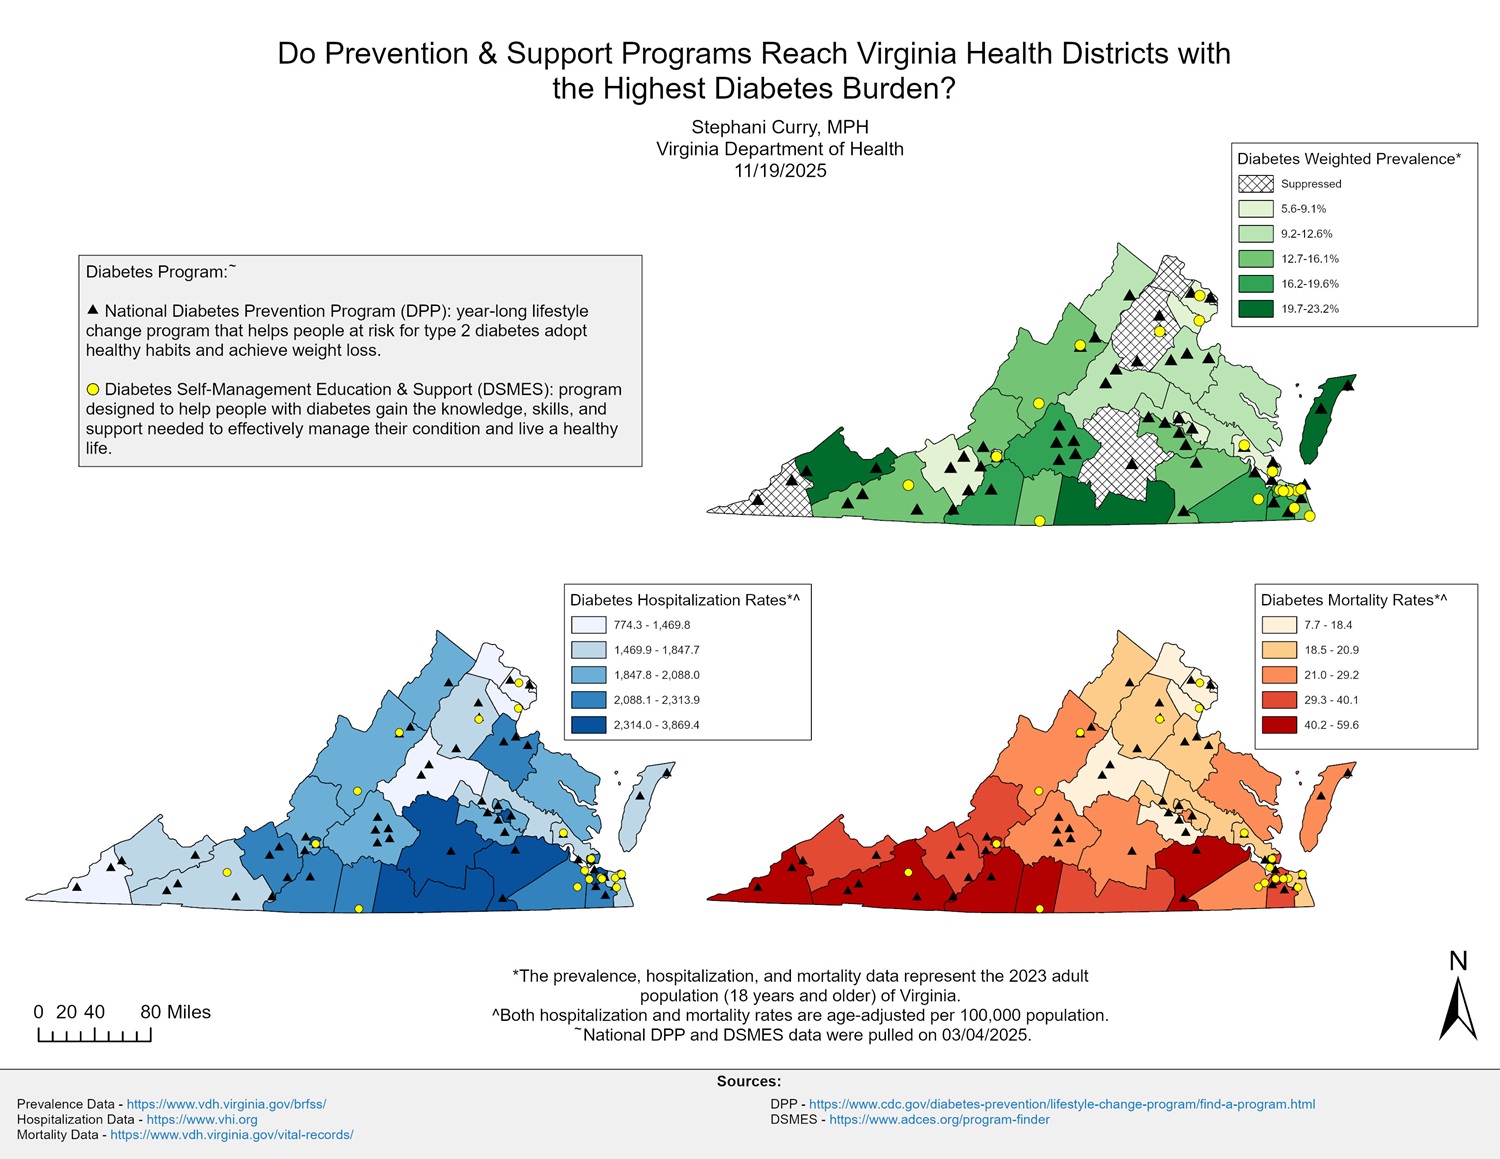
These maps display health district-level prevalence, hospitalization, and death rates for diabetes in Virginia for the adult population in 2023. The maps are overlayed with DSMES and National DPP locations around the state. The highest rates for all three data sources tend to be in the southern portion of the state.
SAS, ArcGIS
BRFSS/PLACES; Hospitalization data; Vital statistics.
Prevalence, hospitalization, and mortality diabetes data were displayed by health district using quantiles. DPP/DSMES locations were geocoded and plotted by address.
While this specific layout of maps has not been utilized so far, health district-level diabetes rates have been accounted for when assessing overall chronic disease burden throughout Virginia for grant planning. The combination of maps in this layout provides important context for decision making regarding the placement of new National DPP and DSMES sites.
Stephani Curry, Chronic Disease Epidemiologist
Virginia Department of Health
stephani.curry@vdh.virginia.gov
940-393-2151
Stephani Curry, Virginia Department of Health. Accessed from the Centers for Disease Control and Prevention's Chronic Disease Map Gallery.