At a glance
Map
Data sources
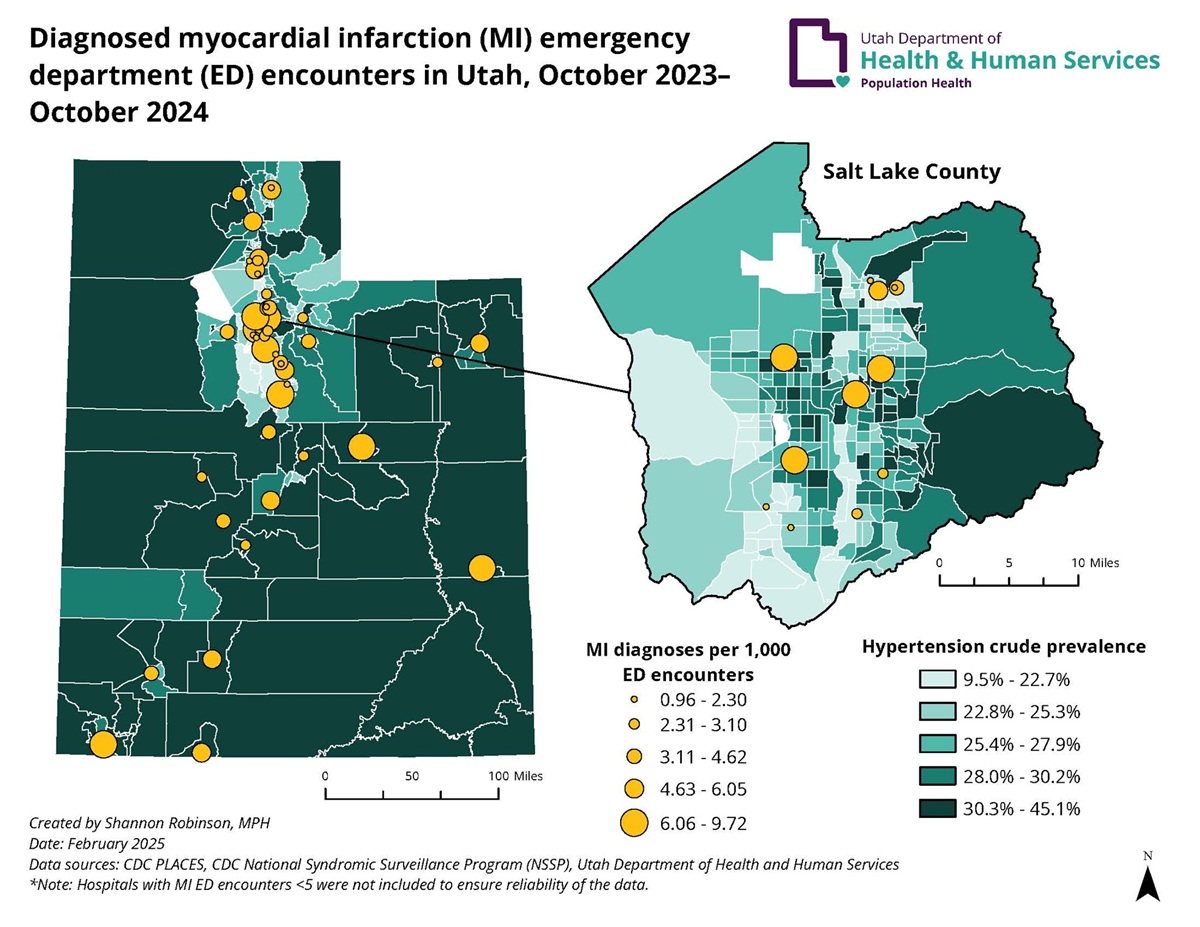
This map displays census-tract level hypertension prevalence in Utah, ages 18 and older, for the year 2023. The highest prevalences (30.3%-45.1%) are located primarily in the rural regions of the state and are a dark green color, while the lowest prevalences (9.5%-22.7%) are located primarily in the urban regions of the state and are light green. This map also displays yellow graduated symbols representing diagnosed myocardial infarction emergency department encounters per 1,000 emergency department counters in Utah, from October 2023 to October 2024. The highest diagnoses of myocardial infarction are found in Salt Lake, Utah, Carbon, Grand, and San Juan counties.
ArcGIS Version 3.3.0, RStudio Version 2024.12.1
BRFSS/PLACES; Hospitalization data; CDC National Syndromic Surveillance Program (NSSP), Utah Department of Health and Human Services.
Emergency department location and discharge diagnosis data were collected using a syndrome definition for myocardial infarction within ESSENCE, a syndromic surveillance platform through CDC's National Syndromic Surveillance Program. The dataset was cleaned using R and imported to ArcGIS Pro as a shapefile. A rate was calculated by dividing the number of diagnosed myocardial infarction emergency department encounters with total number of encounters and multiplied by 1,000.
This rate was displayed using graduated symbol quintiles. Hypertension prevalence (crude) was mapped using CDC PLACES data and displayed using quintiles.
This map will be used to improve cardiovascular work in Utah. Hypertension awareness and prevention will be prioritized in census tracts with the highest rates of hypertension. Additionally, work will be done to improve clinical quality improvement among clinics and hospitals with patients at greatest risk for myocardial infarction and cardiovascular disease.
Shannon Robinson, Diabetes & Heart Disease Epidemiologist/Evaluator
Utah Department of Health and Human Services
385-249-4836
smrobinson@utah.gov
Shannon Robinson, Diabetes & Heart Disease Epidemiologist/EvaluatorUtah Department of Health and Human Services. Accessed from the Centers for Disease Control and Prevention's Chronic Disease Map Gallery.