Key points
Map

Data sources
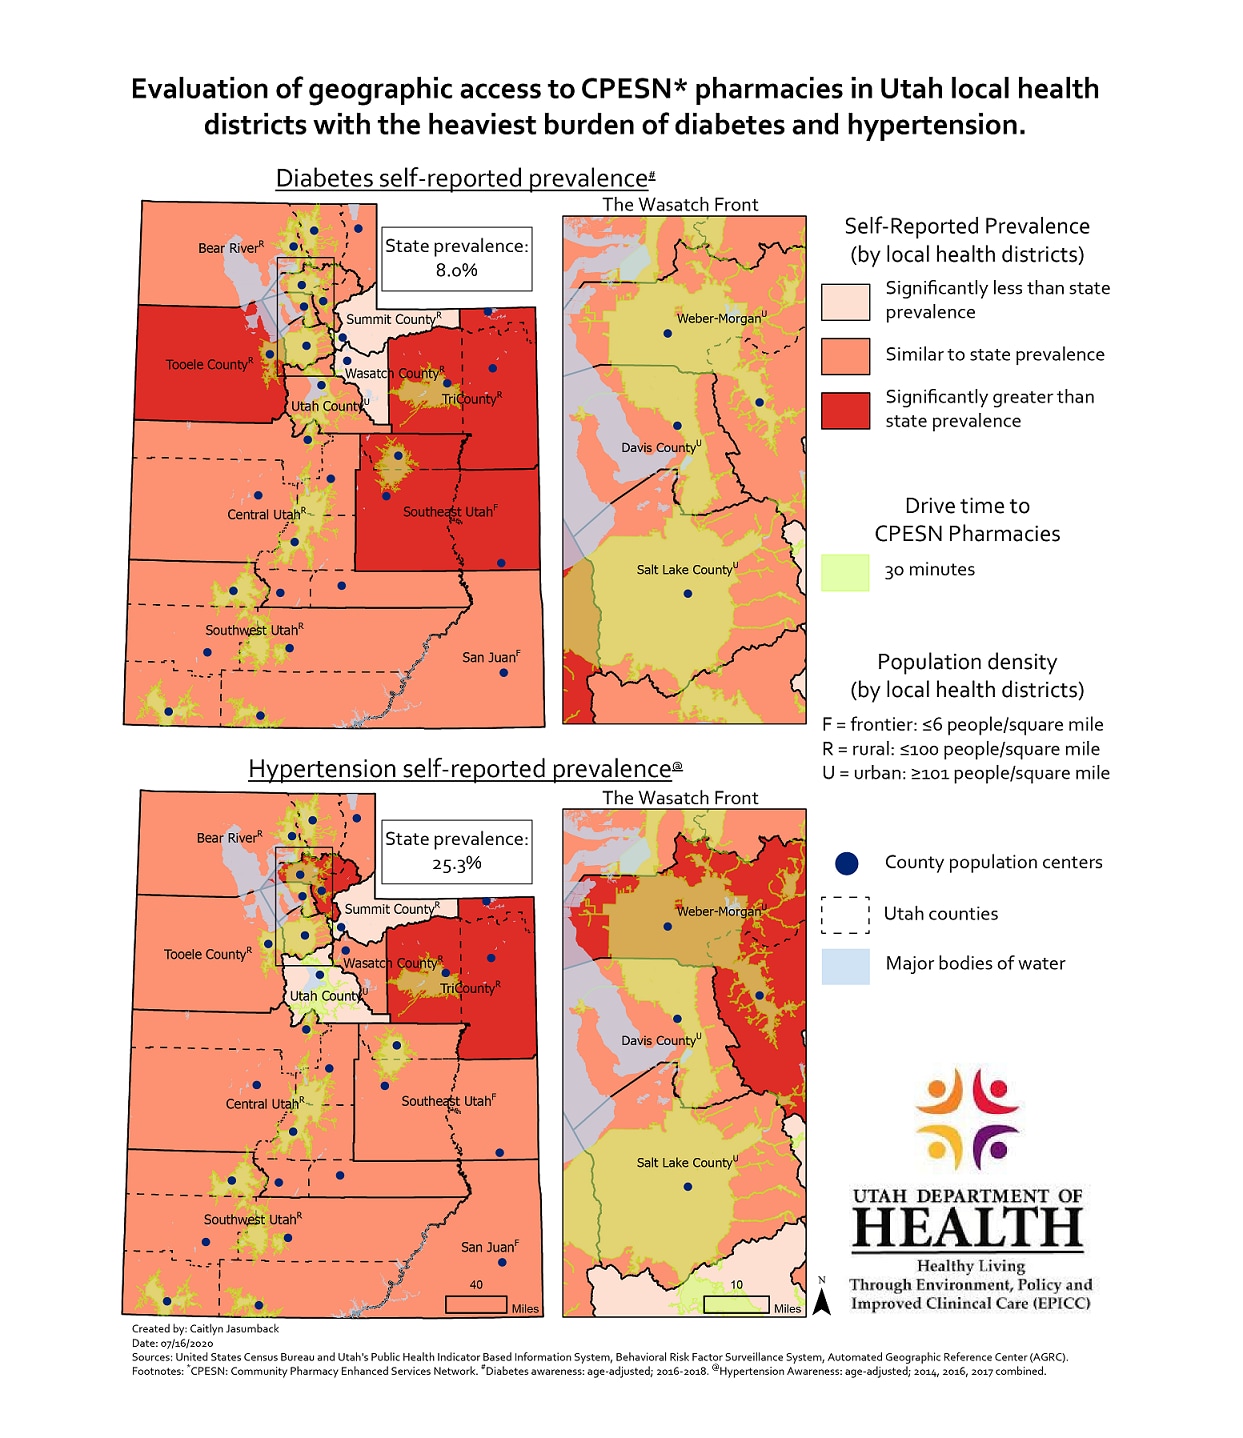
Community Pharmacy Enhanced Services Network (CPESN) pharmacies are concentrated in urban local health districts but not all counties within geographically large local health districts are getting adequate access to CPESN pharmacies.
ArcGIS Pro 2.5.2
Utah’s Public Health Indicator Information System (IBIS), Center for Health data and Informatics, Utah Department of Health. Utah Behavioral Risk Factor Surveillance System (BRFSS). Utah Automated Geographic Reference Center (AGRC). United States Census Bureau.
These choropleth maps display the region-level self-reported prevalence of diabetes (age-adjusted; 2016-2018) and hypertension (age-adjusted; 2014, 2016, 2017 combined) among adults 18 years and older based on the Utah BRFSS. Regions were defined as the 13 local health districts in Utah. The self-reported prevalences for each health district were categorized as statistically lower, higher or the same as the state’s prevalence. Locations of Community Pharmacy Enhanced Services Network (CPESN) pharmacies were retrieved from Utah Department of Health (UDOH) staff working with CPESN pharmacies on April 13th, 2020. The locations were geocoded using ArcGIS Pro 2.5.2. Drive time to CPESN pharmacies was calculated using ArcGIS Pro Network Analysis. Thirty-minute service areas were displayed. Lastly, population density by local health district was calculated from 2018 estimates from Utah’s Public Health Indicator Information System (IBIS) and county population centers were gathered from the 2010 Census.
These maps will be used to inform Centers for Disease Control and Prevention (CDC) grants that are given to state health departments for chronic disease prevention, self-management, and control. Specifically, these maps will inform future grant activities to increase accessibility to pharmacies specializing in Medical Therapy Management (MTM) for Utahns with chronic diseases. Lastly, these maps will be the first in a series of other similar maps with 30-minute drive times to other chronic disease prevention and/or management programs (i.e. CDC-recognized lifestyle change programs, Diabetes Self-Management Education, etc.) that the UDOH is currently working with to further CDC grant related work.
Caitlyn Jasumback, Epidemiologist/Evaluator
Utah Department of Health
801-538-9209
cjasumback@utah.gov
Caitlyn Jasumback, Utah Department of Health. Accessed from the Centers for Disease Control and Prevention's Chronic Disease Map Gallery.
