Key points
Map

Data sources
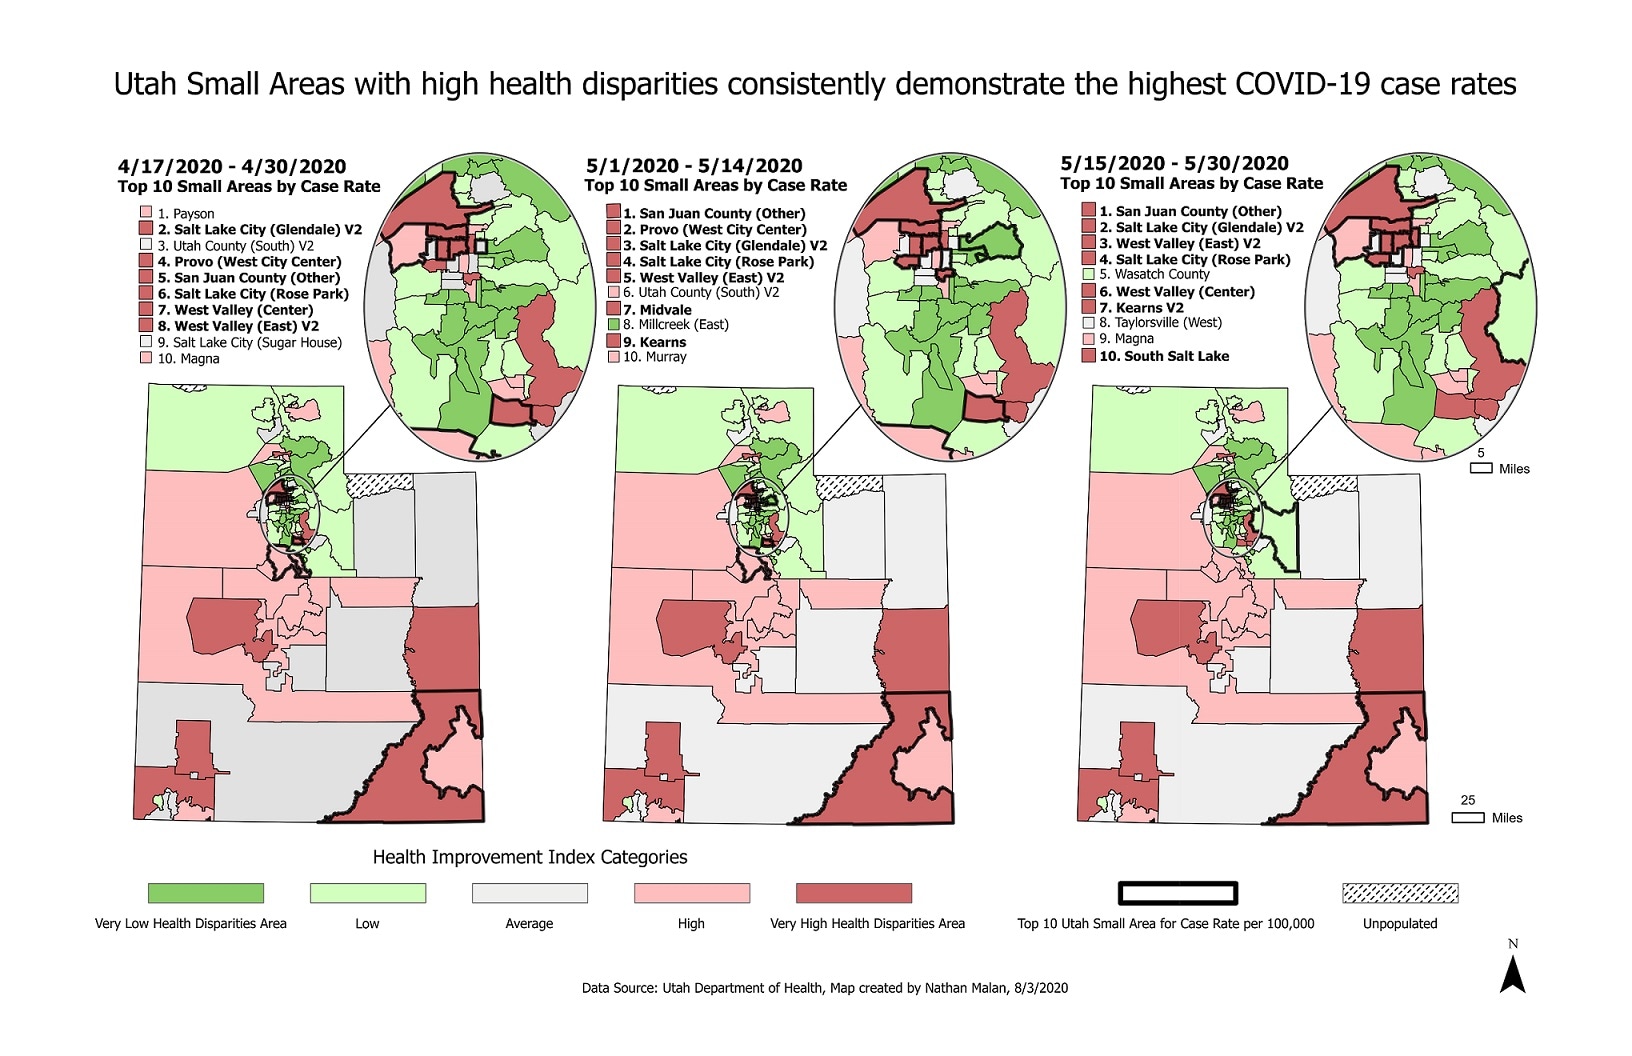
This time series of maps show how COVID-19 disproportionately impacted areas with high health disparities during the early stages of the outbreak. The issue of health disparities has long been a topic of interest and study in chronic disease, however many of the same lessons can be relevant to infectious diseases, such as COVID-19. By focusing on upstream efforts to improve health, environments, access to care, access to leave and childcare, etc… we can help reduce the impact and burden in groups experiencing disproportionate impact.
ArcGIS Pro
Utah Department of Health COVID-19 case rate data, the Utah Health Improvement Index (HII), and Utah Automated Geographic Reference Center (AGRC) prepared projections.
These choropleth maps display the Utah Health Improvement Index (HII) classifications of the 99 Utah Small Areas and highlight (in bold) the top 10 areas impacted by COVID-19 case rates over time. Case rates are calculated using confirmed cases of COVID-19 by Polymerase Chain Reaction (PCR) testing and 2018 population data.
Developed by the Utah Department of Health, the HII is a composite measure of social determinants of health by geographic area. The HII is grounded on methods used by Singh for the Area Deprivation Index (ADI). While the ADI is based on 17 US Census Data markers, the HII derives nine of 17 Census data markers/indicators used for the ADI from BRFSS and computed values for each of Utah's 99 small areas (Those indicators are: % of the population aged ≥25 years with <9 years of education, 5 of population aged ≥25 years with at least a high school diploma, Median family income, Income disparity, percent of owner-occupied housing units, % of civilian labor force population aged ≥16 years unemployed, % of families below poverty level, % of the population below 150% of the poverty threshold, Percent of single-parent households with children aged <18 years). Using BRFSS and small areas data allows the opportunity to look directly at associations between risk factors and health outcomes by geography. Three years of data were combined (2015-2017) to have sufficient sample in each area. A factor analysis was performed on the nine indicators and a single factor solution accounted for 57% of the variance of the matrix. In Singh's paper, his single factor solution accounted for 52% of the variance of the matrix. The rotated factors were used as coefficients and they compared favorably with published Singh coefficients. The composite HII measure was computed for each small area and standardized to a mean of 100 and a standard deviation of 20. A similar measure was computed for each small area using published Singh 2000 coefficients to construct an approximation of the ADI. All small areas HIIs were within 1% of the approximate ADI values, confirming our use of BRFSS and nine indicators. The HII has been found to be a very robust measure that classified small areas identically to the ADI.
These findings have been shared with Utah leadership, the COVID-19 task force, and recently a MMWR proposal was submitted to the CDC by UDOH taking a deeper dive into this issue.
Nathan Malan, Utah Department of Health
Michael Friedrichs, Utah Department of Health
Nathan Malan, Utah Department of Health; Michael Friedrichs, Utah Department of Health. Accessed from the Centers for Disease Control and Prevention's Chronic Disease Map Gallery.
