Key points
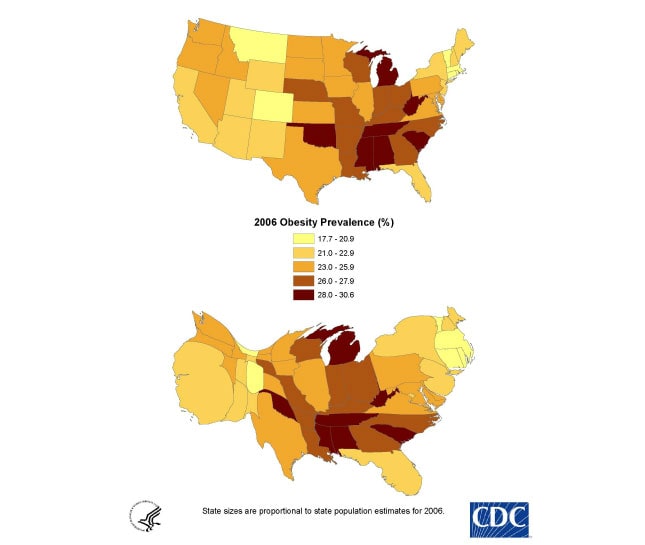
This map was part of an exploratory study that used cartograms and other cartographic techniques to visually communicate the pattern of obesity prevalence.
Data sources
ArcInfo Workstation, ArcGIS, Gastner-Newman cartogram program.
Obesity Prevalence.
Gastner-Newman cartogram.
James B. Holt, Team Leader, Analytic Methods, Centers for Disease Control and Prevention
(770) 488-5510
jgh4@cdc.gov
Obesity Prevalence 2006 James B. Holt, [TODAY’S DATE]. Accessed from the Centers for Disease Control and Prevention's Chronic Disease Map Gallery.

