Key points
Data sources
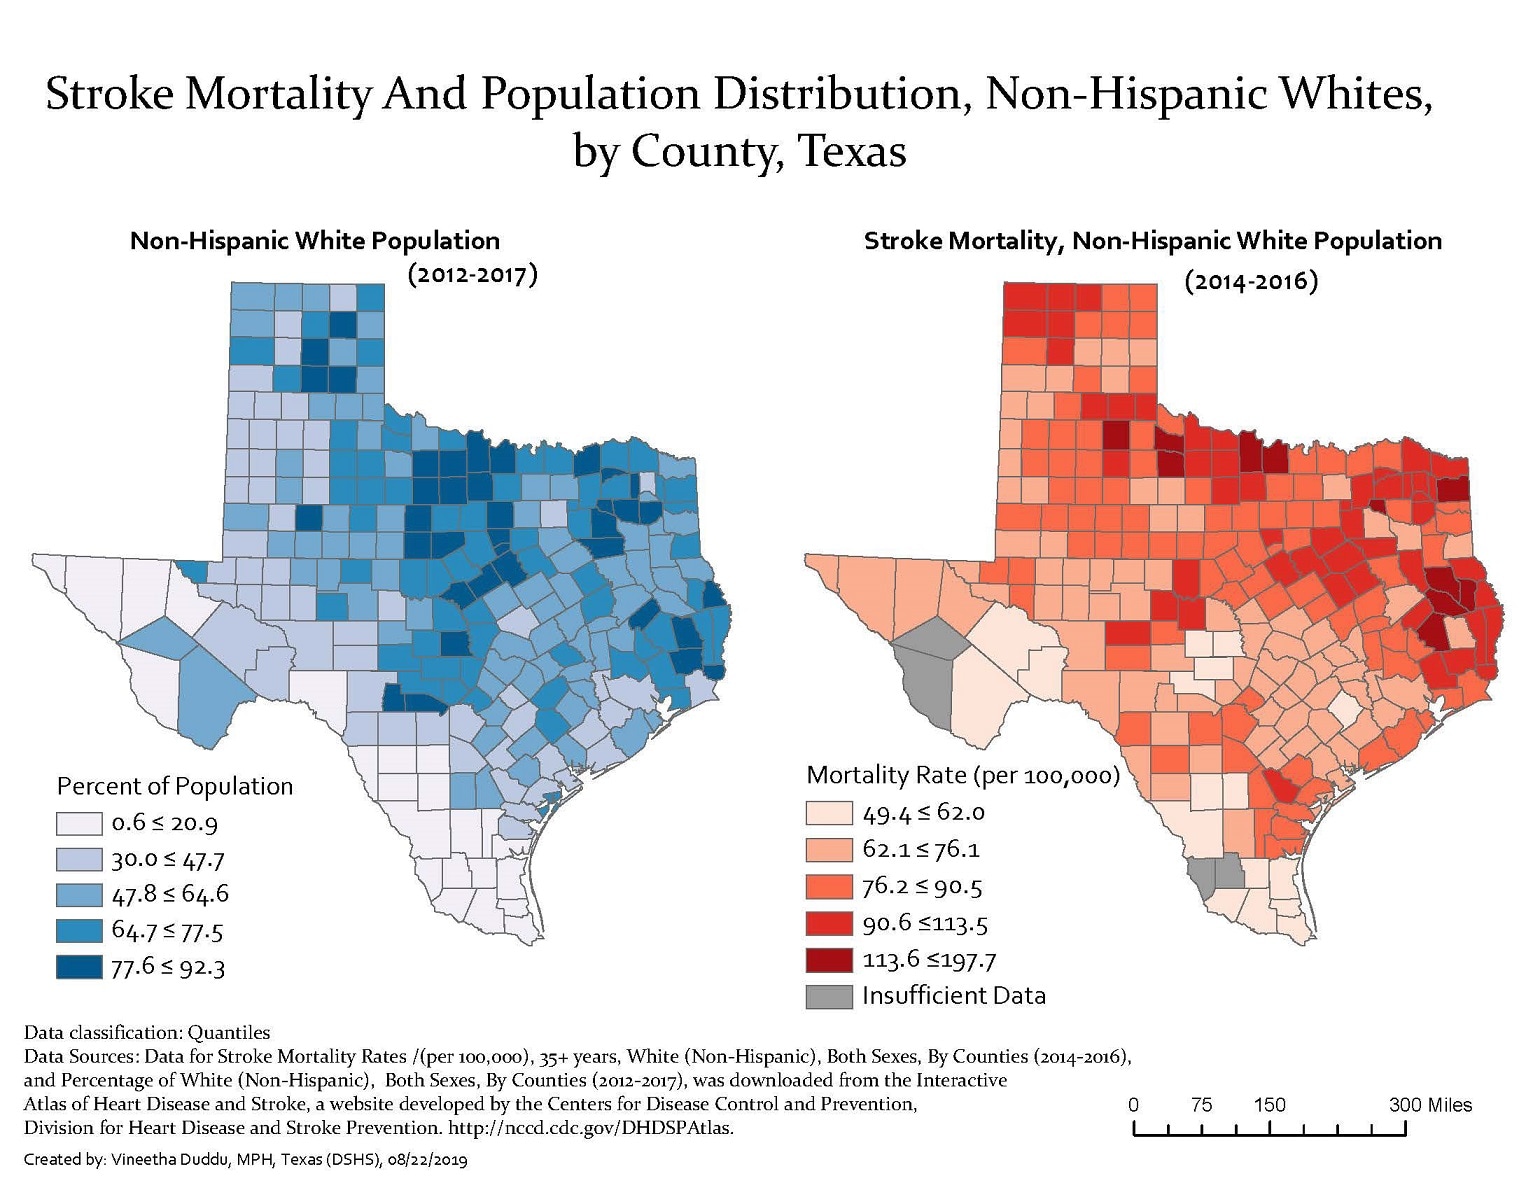
This map allows the readers to see a pattern in the dispersion of Non-Hispanic White populations and stroke mortality rates in the state of Texas: there is a denser population of Non-Hispanic whites and higher stroke mortality rates among Non-Hispanic whites in the northern, central, and eastern parts of Texas. Additionally, counties in the western and southern parts of Texas generally have smaller percentages of Non-Hispanic whites and lower stroke mortality rates among non-Hispanic whites.
ArcGIS
The data used for these maps are county-level stroke mortality rates (per 100,000) and county-level percentage of the Non-Hispanic White population. Stroke mortality rates for Non-Hispanic Whites for 35 years and older, both sexes, were calculated (2014-2016). Distribution of the Non-Hispanic White population in both sexes, are from the years 2012-2017. Data for both the maps were downloaded from the Interactive Atlas of Heart Disease and Stroke, a tool developed by the Centers for Disease Control and Prevention. http://nccd.cdc.gov./DHDSPAtlas.
Two maps were created, with one depicting the Non-Hispanic White population in Texas, and the other depicting the stroke mortality rates for Texas, by county. The data for percentage of Non-Hispanic whites and age-adjusted stroke mortality rates (per 100,000) were displayed using graduated colors. Five classes of quantiles were used for data classification. A red monochromatic color ramp was used to depict the stroke mortality rates, and a blue monochromatic color ramp was used for Non-Hispanic White population percentages. Counties with insufficient data are colored in grey. Both the maps were displayed on a horizontal layout, on NAD 1983 Texas Statewide Mapping System projection coordinates.
Vineetha Duddu, MPH, Texas Department of State Health Services
Vineetha Duddu, MPH, Texas Department of State Health Services. Accessed from the Centers for Disease Control and Prevention's Chronic Disease Map Gallery.

