At a glance
Data sources
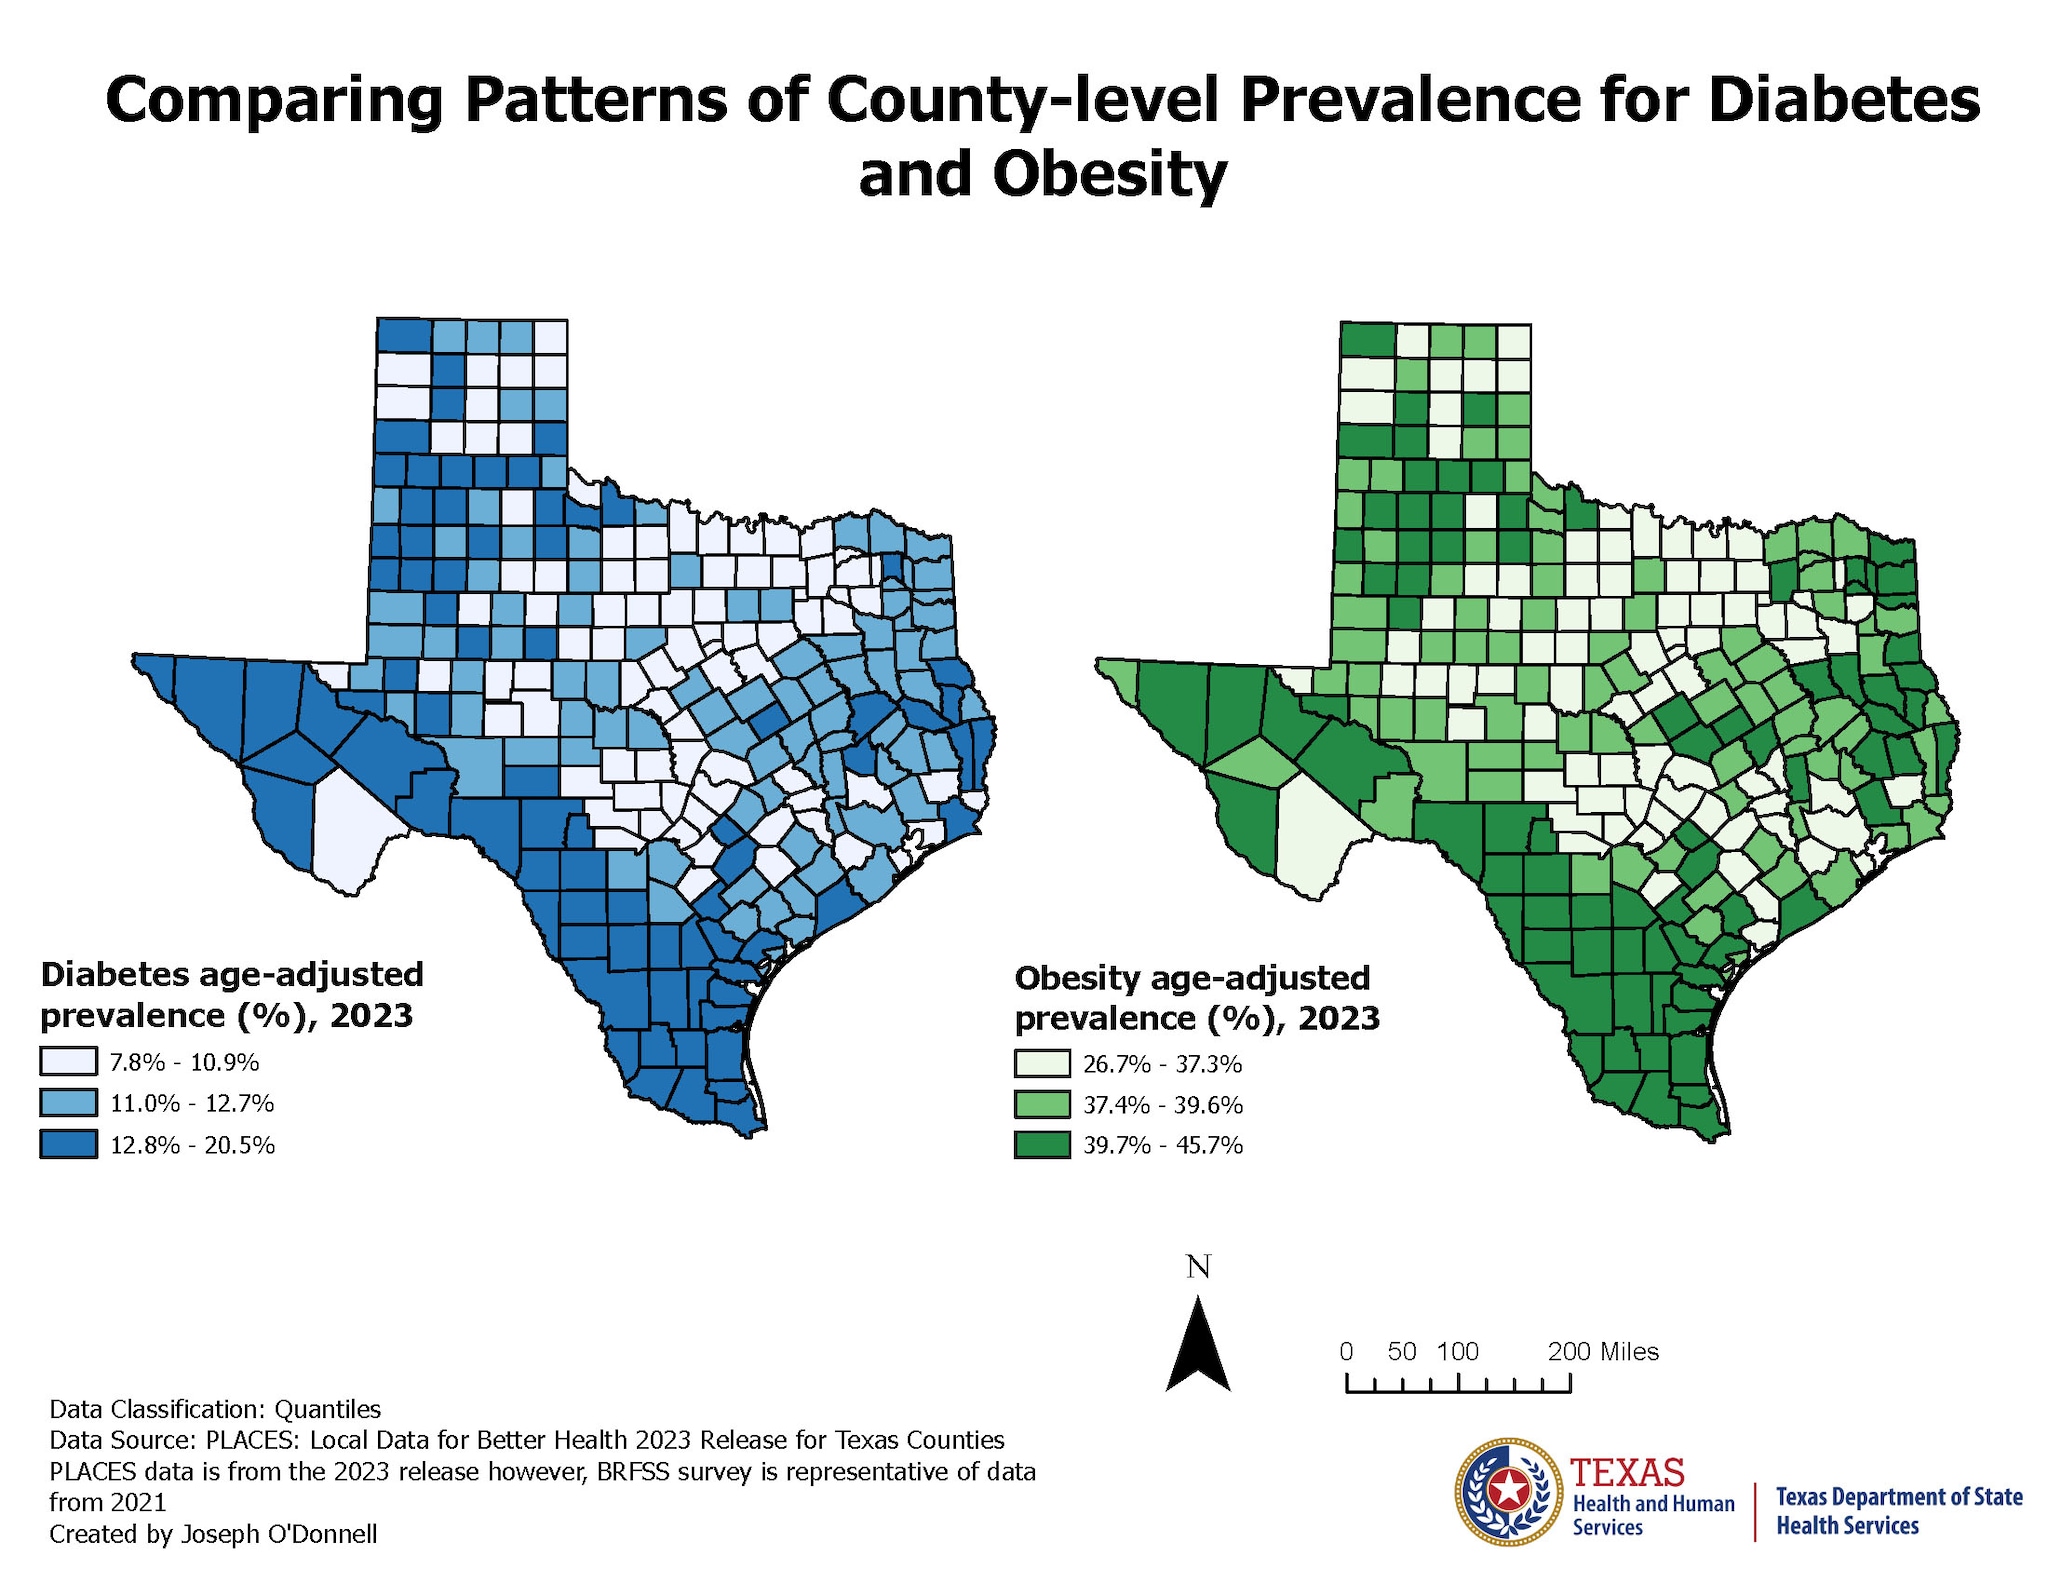
This map illustrates county-level age-adjusted prevalence data for diabetes and obesity for the state of Texas. Areas in the highest tertile for both diabetes and obesity are in the south, southwest, and panhandle. Areas with the lowest tertile for both diabetes and obesity can be found in central and north Texas.
ArcGIS Pro 3.1.2
BRFSS/PLACES
Age-adjusted prevalence of diabetes and obesity were displayed using tertiles. Data was obtained from PLACES: Local Data for Better Health for the state of Texas by county and displayed using a choropleth map.
This map will be shown to the diabetes and obesity prevention programs for future program and intervention activities incorporating specific DSMES (Diabetes Self-Management Education) and DPP (Diabetes Prevention Program)-specific interventions. This map can also be used as a starting point to further investigate the demographic characteristics of the counties in the highest tertile for both diabetes and obesity to further target interventions.
Joseph O'Donnell, Epidemiology II
Texas Department of State Health Services
Joseph.odonnell@dshs.texas.gov
Joseph O'Donnell, Epidemiology II, Texas Department of State Health Services. Accessed from the Centers for Disease Control and Prevention's Chronic Disease Map Gallery.

