Key points
Map

Data sources
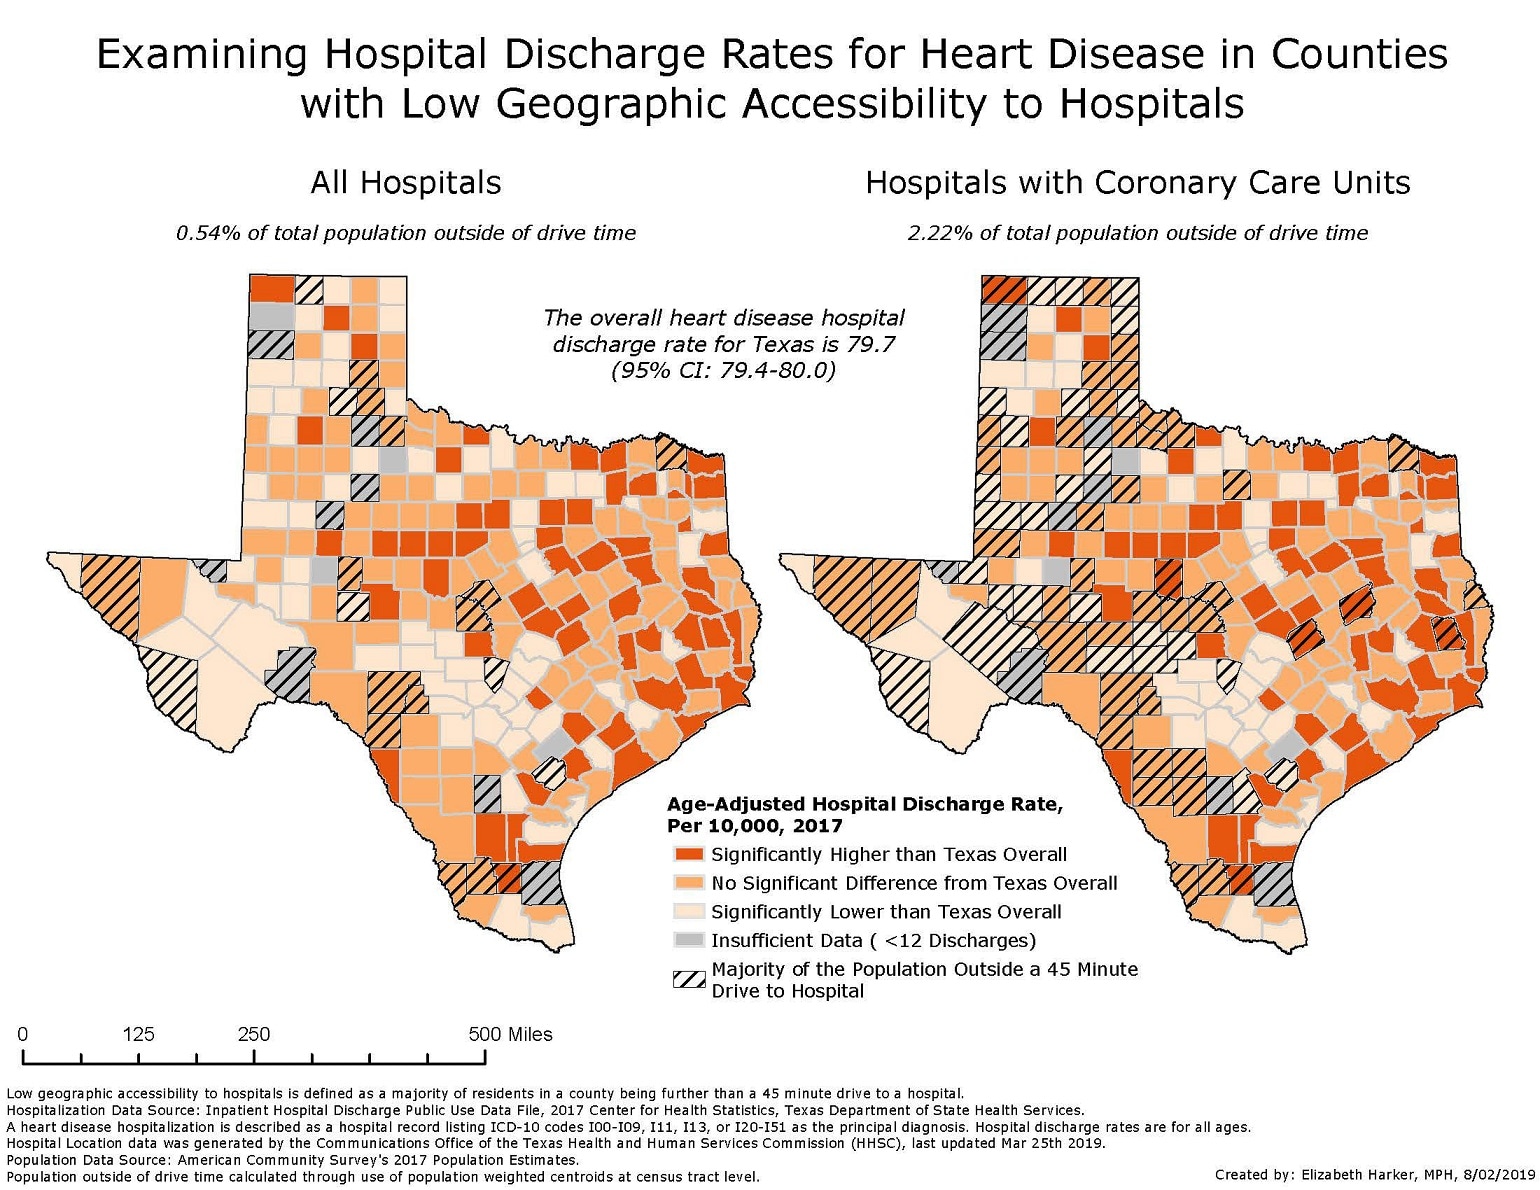
These maps allow readers to see, relative to Texas, where there are areas of high hospitalization due to heart disease, and if the population is within a 45-minute drive of a hospital. The majority of the population of Texas is within a 45-minute drive of a hospital, including hospitals with coronary care units. Twenty-eight of Texas’ 254 counties have populations that are outside of a 45-minute drive to a hospital, and only one of those has higher-than-average hospitalizations for heart disease. Seventy-eight counties have populations where the majority are more than a 45-minute drive to a hospital with a coronary care unit, and six of those have higher than average hospitalization rates. Counties with high hospitalization rates, especially those whose populations are not close to a hospital, may be areas to focus further prevention activities.
ArcGIS
Hospitalization data is from the Inpatient Hospital Discharge Public Use Data File, 2017, Center for Health Statistics, Texas Department of State Health Services. Hospital location data was generated by the Communications Office of the Texas Health and Human Services Commission (HHSC), last updated March 25, 2019. Population data were acquired from the American Community Survey’s 2017 Population Estimates.
Age-adjusted heart disease hospitalization discharge rates with 95% confidence intervals (CI) were calculated using SAS, version 9.4, for each county and the state overall. The 95% CIs were used to determine if a county’s discharge rate was, statistically, significantly different from that of the state overall. A service area analysis was performed in order to determine the area encompassed within a 45-minute drive of a hospital. This analysis was done twice: first with all hospitals and second with only hospitals listed as having a coronary care unit. Populations were estimated using population weighted centroids calculated to the census tract level. The percent of the population in each county outside of the drive time was then calculated. The total of the Texas population outside of the drive time was also calculated using the population weighted centroids.
Elizabeth Harker, MPH, Chronic Disease Epidemiology Branch, Texas Department of State Health Services
Elizabeth Harker, MPH, Chronic Disease Epidemiology Branch, Texas Department of State Health Services. Accessed from the Centers for Disease Control and Prevention's Chronic Disease Map Gallery.
