Key points
Data sources
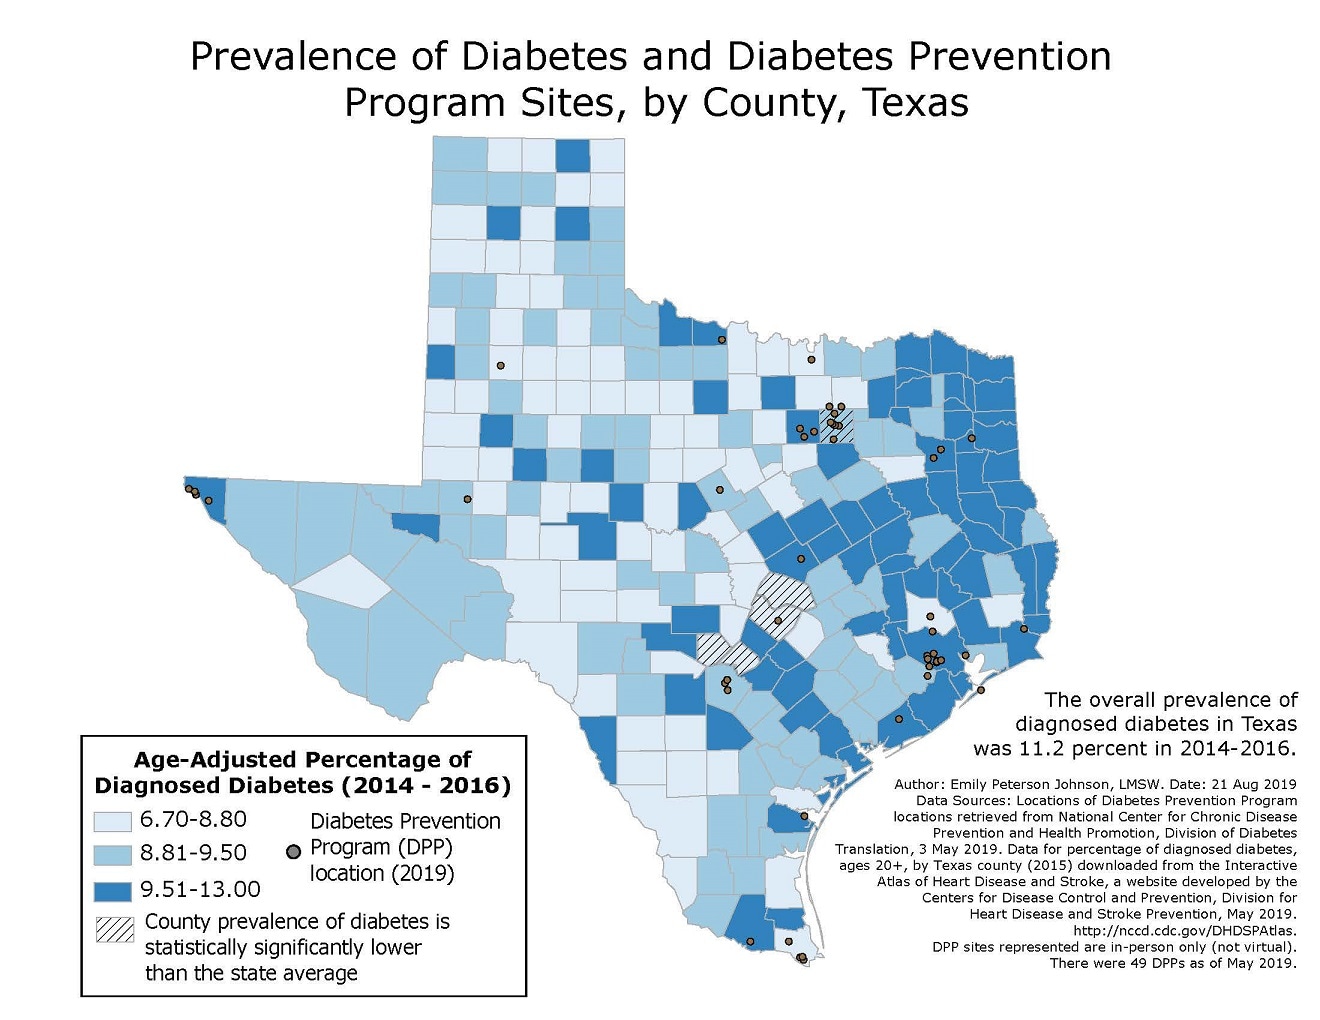
This map allows readers to identify the geographic spread of diagnosed diabetes prevalence compared to the locations of Diabetes Prevention Programs throughout Texas. A primary finding from this map is that East Texas has a higher burden of diagnosed diabetes, compared to the rest of the state. Additionally, this map emphasizes the geographic inequities of the DPP locations. For example, Dallas County (which includes the city of Dallas) has a statistically significantly lower rate of diabetes than the state overall and has six DPP sites. Conversely, many counties with the highest rates of diagnosed diabetes do not have a DPP site within or near them. This indicates a need to increase the number of DPP sites in counties in East Texas with a high prevalence of diagnosed diabetes.
ArcGIS
County-level estimates of diagnosed diabetes among adults aged 20 years and older were determined using the CDC's Behavioral Risk Factor Surveillance System (BRFSS) and the U.S. Census Bureau's Population Estimates Program. Diagnosed diabetes was defined as a "Yes" response to the BRFSS survey question, "Has a doctor ever told you that you have diabetes?". Women who indicated they had diabetes only in pregnancy were excluded from the analysis.
Three years of data (2014-2016) were used in order to improve precision of year-specific and county-level estimates. Age adjustments were calculated based on the U.S. population in 2000 using the following age groups: 20-44, 45-64, and 65 or older. These analyses were performed by the CDC and made publicly available on the Interactive Atlas of Heart Disease and Stroke, a website developed by the CDC Division for Heart Disease and Stroke Prevention. Data were retrieved from the website on May 23, 2019. (https://nccd.cdc.gov/dhdspatlas/)
Data for the locations of Diabetes Prevention Programs (DPPs) were retrieved from the National Center for Chronic Disease Prevention and Health Promotion, Division of Diabetes Translation, with assistance from the Children's Environmental Health Initiative (CEHI) at Rice University. Data were downloaded on May 3, 2019. DPP sites that were only virtual were not included in the map. (https://nccd.cdc.gov/DDT_DPRP/Programs.aspx)
Data for rates of diagnosed diabetes were displayed using a three-category legend with quantile methodology and graduated colors. Five counties were found to have statistically lower rates of diagnosed diabetes, compared to the state overall. Statistical significance was determined by comparing overlapping 95% confidence intervals. These counties are delineated using the grey hatch-marks. The color scheme was selected using Color Brewer recommendations for three-class legends with respect to being friendly to readers who are color blind and/or are using screens to view the map. The map was displayed with the NAD 1983 Texas Statewide Mapping System coordinates.
Emily Johnson, LMSW, Chronic Disease Epidemiology Branch Texas Department of State Health Services
Emily Johnson, LMSW, Chronic Disease Epidemiology Branch Texas Department of State Health Services. Accessed from the Centers for Disease Control and Prevention's Chronic Disease Map Gallery.

