At a glance
Map

Data sources
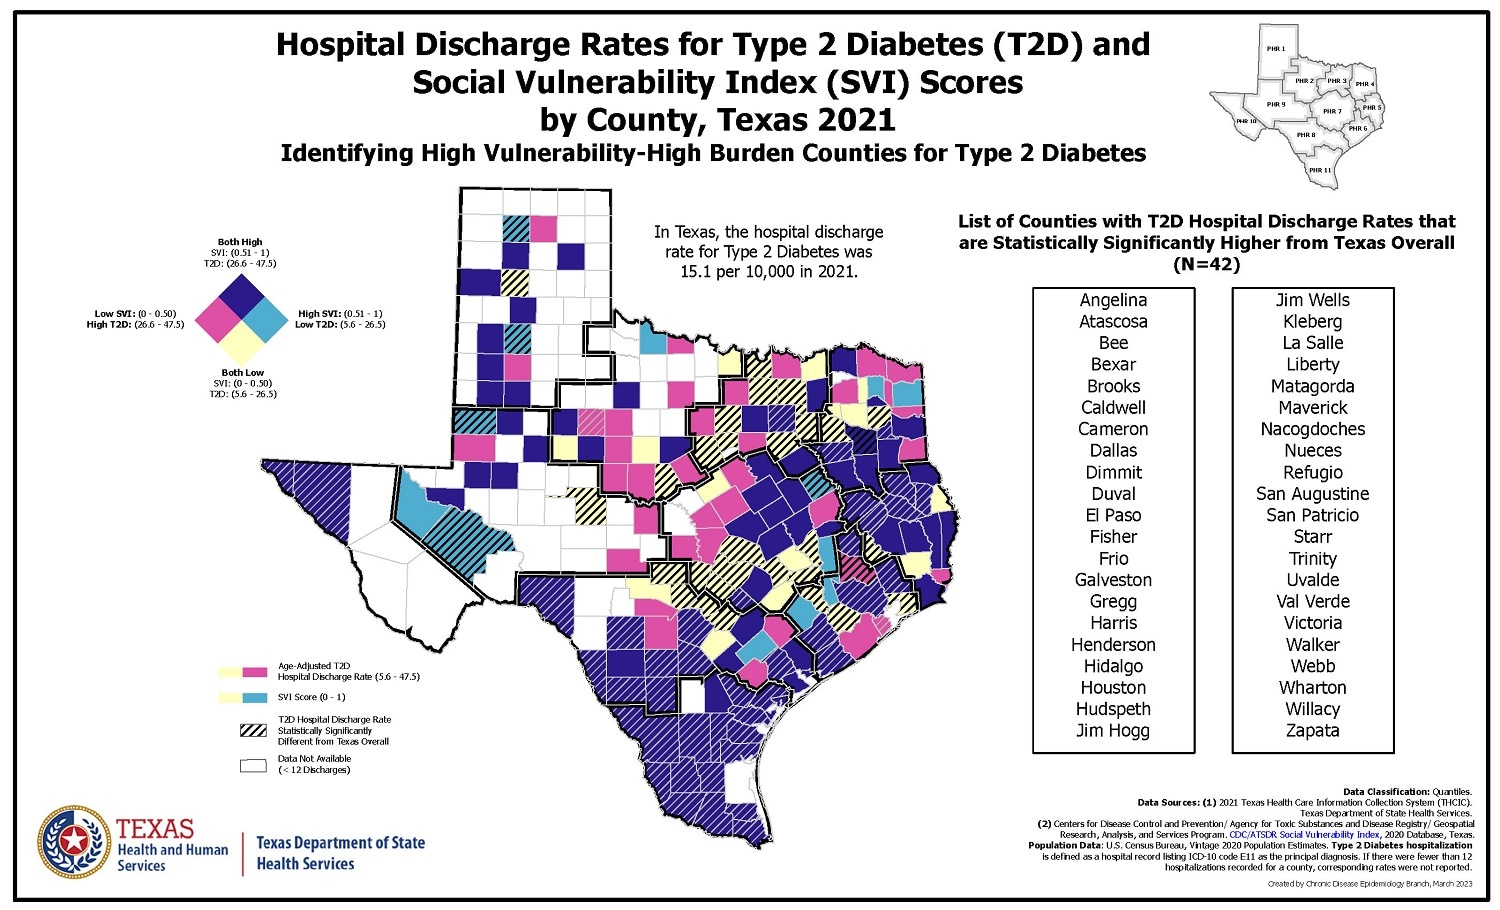
The main map illustrates variations in counties with varying levels of age-adjusted type 2 diabetes hospital discharge rates and social vulnerability for the state of Texas, for the year 2021. A smaller reference map displays the various public health regions (total of 11) for the state of Texas, for the year 2021. More specifically, the overall vulnerability is determined through an assessment of four themes: (1) socioeconomic status (2) household characteristics (3) racial & ethnic minority status, and (4) housing type & transportation.
ArcGIS Pro 3.0
BRFSS/PLACES; Atlas of Heart Disease and Stroke; U.S. Census; Centers for Disease Control and Prevention/Agency for Toxic Substances and Disease Registry/Geospatial Research, Analysis, and Services Program. CDC/ATSDR Social Vulnerability Index, 2020 Database, Texas; 2021 Texas Health Care Information Collection System (THCIC).
- Initially, the 2021 age-adjusted type 2 diabetes (T2D) hospitalization discharge visits by county dataset was joined with a county-level Texas base map and subsequently with a separate 2020 social vulnerability index (SVI) scores by county dataset - Following the join, a symbology of bivariate classification (2x2) was applied.
- Based on an examination of the range of values associated with age-adjusted T2D hospital discharge rates and SVI scores, a selection of low and high value ranges was determined by the 50th percentile: [low T2D (5.6 – 26.5), high T2D (26.6 – 47.5)]; [low SVI (0 – 0.50), high SVI (0.51 – 1)] Simultaneously, a color of white was assigned to counties with fewer than 12 discharges.
- Counties were determined to have stroke hospitalization rates higher or lower than the state rate if the 95% confidence intervals were above or below the state rate (15.1 per 10,000).
- A new list of counties that were statistically significantly higher from Texas overall was generated by applying the "data engineering" tool.
- Thereafter, the bivariate map was overlapped with a blank PHR-based map that displayed distinct borders (applied donut effect).
- Likewise, a blank PHR-based reference map with distinct borders was also created with addition of supplemental donut effect.
This map has the potential to be useful for a variety of purposes, including incorporation into annual factsheets for dissemination to pertinent regional stakeholders/community leaders (e.g. American Diabetes Association (ADA) recognized or Association of Diabetes Care & Education Specialists (ADCES) accredited Diabetes Self-Management Education and Support (DSMES) services, Texas Diabetes Council), developing statewide infrastructure for Community Health Worker (CHW) sustainability and reimbursement, serving as a reference for both current and future diabetes-related grant proposals, and inclusion into potential research manuscript for future publication or presentation at key conferences (e.g. APHA, CSTE, etc.)
Yiyao Li, Diabetes and Obesity Epidemiologist
Texas Department of State Health Services
225-278-7063
Yiyao.Li@dshs.texas.gov
Yiyao Li, Diabetes and Obesity Epidemiologist, Texas Department of State Health Services. Accessed from the Centers for Disease Control and Prevention's Chronic Disease Map Gallery.
