Key points
Data sources
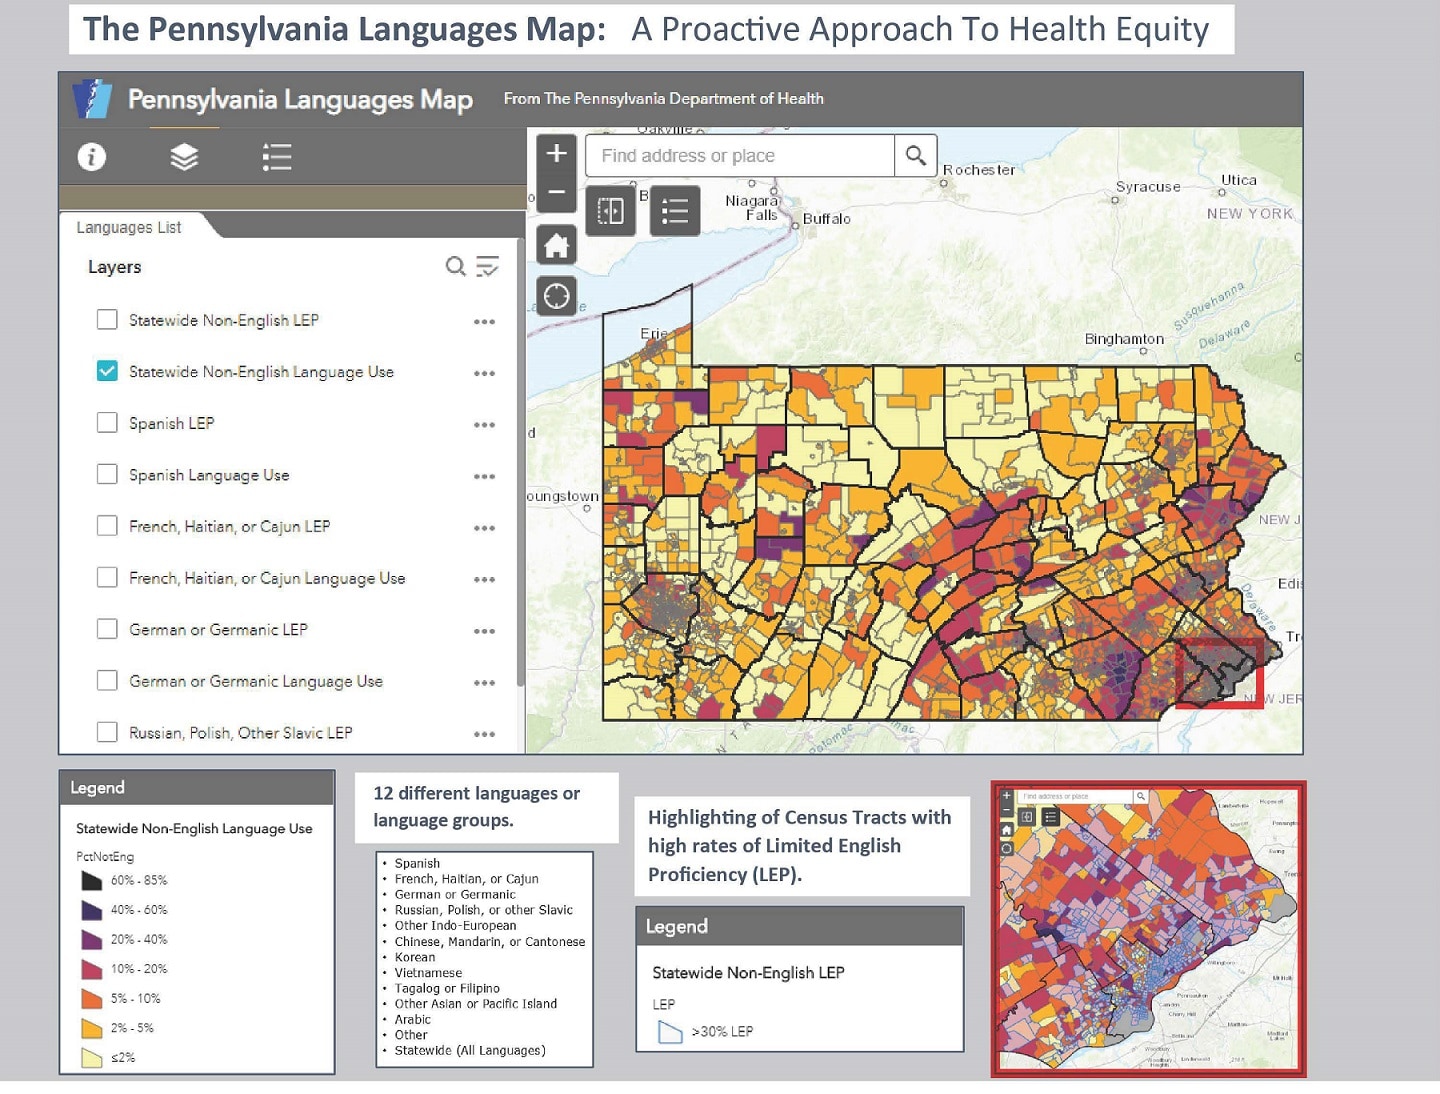
The Pennsylvania Languages Map provides the ability to identify foreign language speaking populations in a specific geographic area before providing services. This allows staff from the Pennsylvania Department of Health and other state agencies to assess the need for translated materials and translation services and proactively mitigate the obstacles that can occur when the population in a particular community speak primarily languages other than English.
ArcGIS
American Community Survey 2017 5-Year Estimates (2013-2017), table C16001: LANGUAGE SPOKEN AT HOME FOR THE POPULATION 5 YEARS AND OVER; TIGER/Line Shapefile, 2015, state, Pennsylvania, Current Census Tract State-based, U.S. Department of Commerce, U.S. Census Bureau (http://www2.census.gov/geo/tiger/TIGER2015/TRACT/tl_2015_42_tract.zip)
Tract level data from the US Census 2017 American Community Survey 5-Year Estimates (2013-2017), table C16001, was obtained using the American Fact Finder (www.factfinder.census.gov) on March 19, 2019. This data was geographically limited to all Census Tracts within Pennsylvania (n=3,218) and contained population estimates for Pennsylvania residents (5 years and over) who speak one of the 12 most common languages/language groups (L/LG) in Pennsylvania and their corresponding English Proficiency. Population counts displayed in the map (excluding English-only, HD01_VD02 & HD02_VD02) for each language/language group (e.g. HD01_VD03) and corresponding high (e.g. HD01_VD04 “very well”) and low (e.g. HD01_VD05 “less than ‘very well’”) English Proficiency. Percentage of Census Tract population for each L/LG was calculated by dividing the estimated tract population count for each language by the estimated total population count (HD01_VD01) of each tract (e.g. (HD01_VD03 ÷ HD01_VD01) x 100 ). Tract specific percentages for high and low English Proficiency were calculated for each L/LG by dividing the estimated high or low proficiency population count by the corresponding total L/LG population count for that tract (e.g. (HD01_VD04 ÷ HD01_VD03) x 100 ). Using ArcGIS Pro, the data was spatially joined in to the Census Tract boundary shapefile (see data source #2) for naming and labeling purposes. The resultant data was copied to 26 individual visualized layers which created a L/LG population percentage layer and low English Proficiency layer for each L/LG and additional statewide aggregate layers of all L/LGs. Population count layers were visually represented using a varying number of classes for each layer and manual interval breaks; the number of classes and interval breaks were determined by the map author by comparing the maximum and minimum tract population percentage for each L/LG and use the fewest number of classes while maintaining logical and useful interval breaks. Low English Proficiency (LEP) layers were visualized for each L/LG to highlight only Census Tracts where the LEP percentage was higher than 30%. Highlighting was achieved by using a display filter with a contrasting border and opaque fill color. The map was then exported from ArcGIS Pro to ArcGIS Online where pop-ups were configured for each L/LG layer to provide tract-specific information about population counts, percentages, and LEP. Once this was completed, the map was turned into an interactive Web App using the ArcGIS Web AppBuilder and published.
Adam R. Overmiller, MPA, Pennsylvania Department of Health
Adam R. Overmiller, MPA, Pennsylvania Department of Health. Accessed from the Centers for Disease Control and Prevention's Chronic Disease Map Gallery.

