At a glance
Map

Data sources
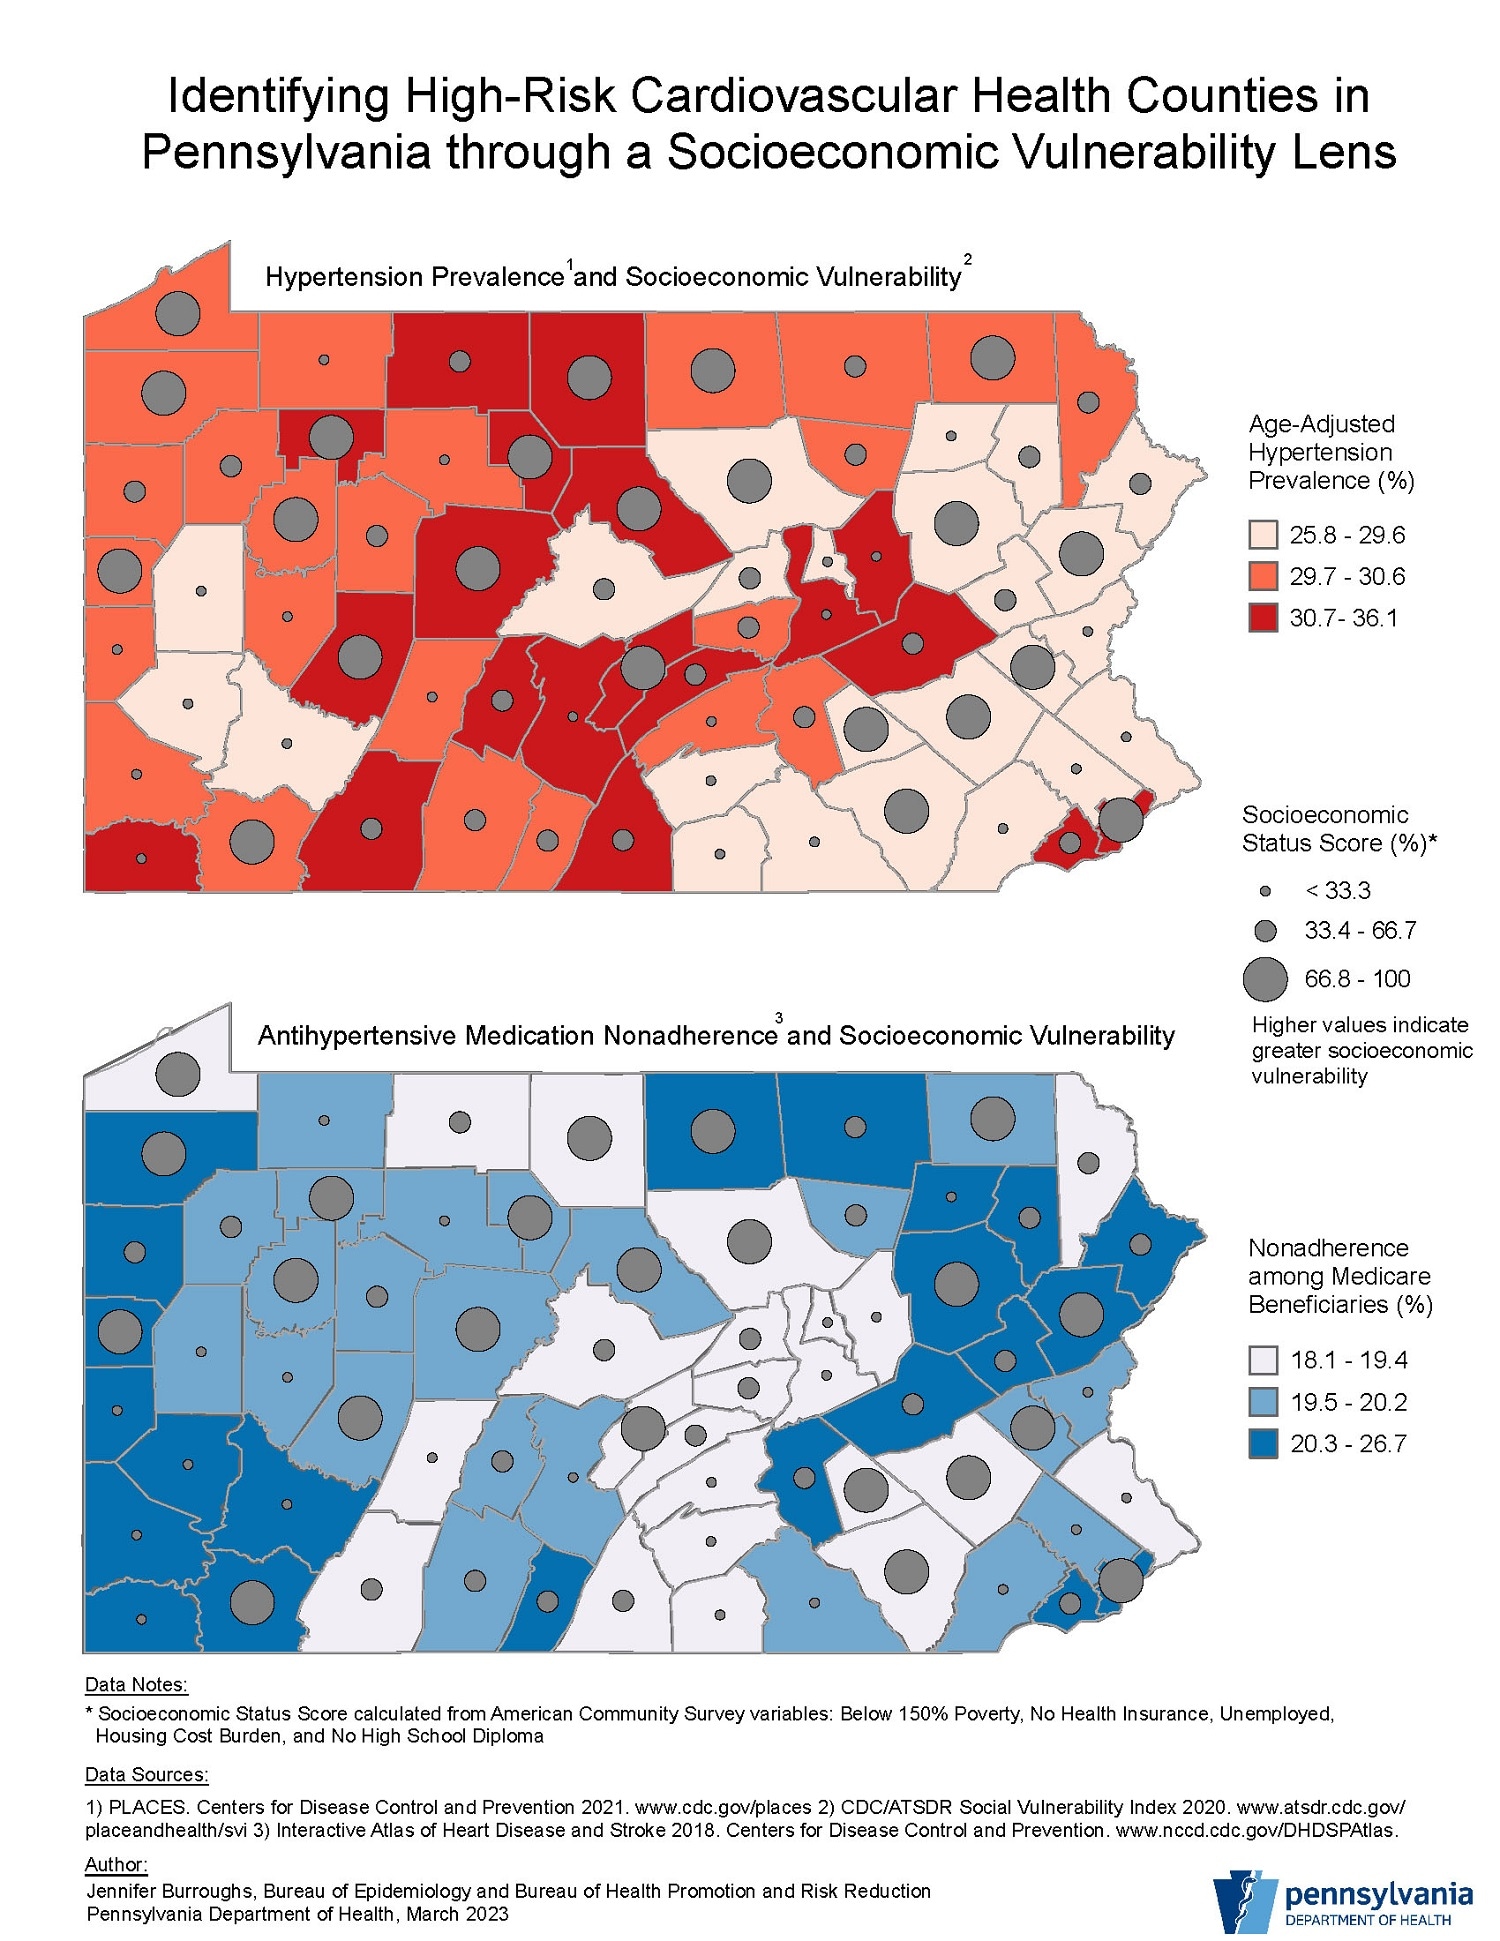
The maps display county-level age-adjusted hypertension prevalence, antihypertensive medication nonadherence, and socioeconomic vulnerability. Philadelphia County is the only county in the highest tertile for hypertension prevalence, medication nonadherence, and socioeconomic vulnerability.
Counties in the highest tertile for hypertension prevalence are located primarily in the central and western areas of the Commonwealth with several such as Forest, Indiana, and Clearfield also being among the most socioeconomically vulnerable.
Counties in the highest category for medication nonadherence are located primarily in the westernmost and northeastern regions of the Commonwealth with several such as Fayette, Luzerne, and Monroe also being among the most socioeconomically vulnerable. Identifying the most socioeconomically vulnerable counties with the highest risk of cardiovascular disease will help target community-based interventions aimed at improving cardiovascular health.
ArcGIS Pro 3.0
BRFSS/PLACES; Atlas of Heart Disease and Stroke; CDC/ATSDR Social Vulnerability Index 2020 Pennsylvania Release.
County-level age-adjusted hypertension prevalence from the CDC Places 2021 dataset is displayed in tertiles using a graduated color scheme. County-level antihypertensive medication nonadherence among Medicare beneficiaries from the CDC Interactive Atlas of Heart Disease and Stroke 2018 dataset is displayed in tertiles using a graduated color scheme. Socioeconomic status scores were obtained for each county from the CDC/ATSDR Social Vulnerability Index 2020 dataset for Pennsylvania. Socioeconomic status scores are one of four measures under Social Vulnerability Index, which are calculated from American Community Survey Variables based on: (1) Below 150% Poverty; (2) Unemployed; (3) Housing Cost Burden; (4) No High School Diploma; and (5) No Health Insurance. Socioeconomic status scores are displayed on each map using graduated symbols with higher values indicating greater socioeconomic vulnerability.
The maps will be used to inform policy decisions regarding implementation of community-based cardiovascular health improvement programs. The Bureau of Health Promotion and Risk Reduction at the Pennsylvania Department of Health is implementing a Blood Pressure Self-Monitoring Program at the county level in Spring 2023. The maps will be used to assist with selecting community organization partners by identifying those counties with the highest socioeconomic vulnerability in conjunction with hypertension prevalence and antihypertensive medication nonadherence.
Jennifer Burroughs, Epidemiology Program Specialist
BHPRR, Pennsylvania Department of Health
352-281-5583
jenburroug@pa.gov
Jennifer Burroughs, Epidemiology Program Specialist, BHPRR, Pennsylvania Department of Health. Accessed from the Centers for Disease Control and Prevention's Chronic Disease Map Gallery.
