At a glance
Map

Data sources
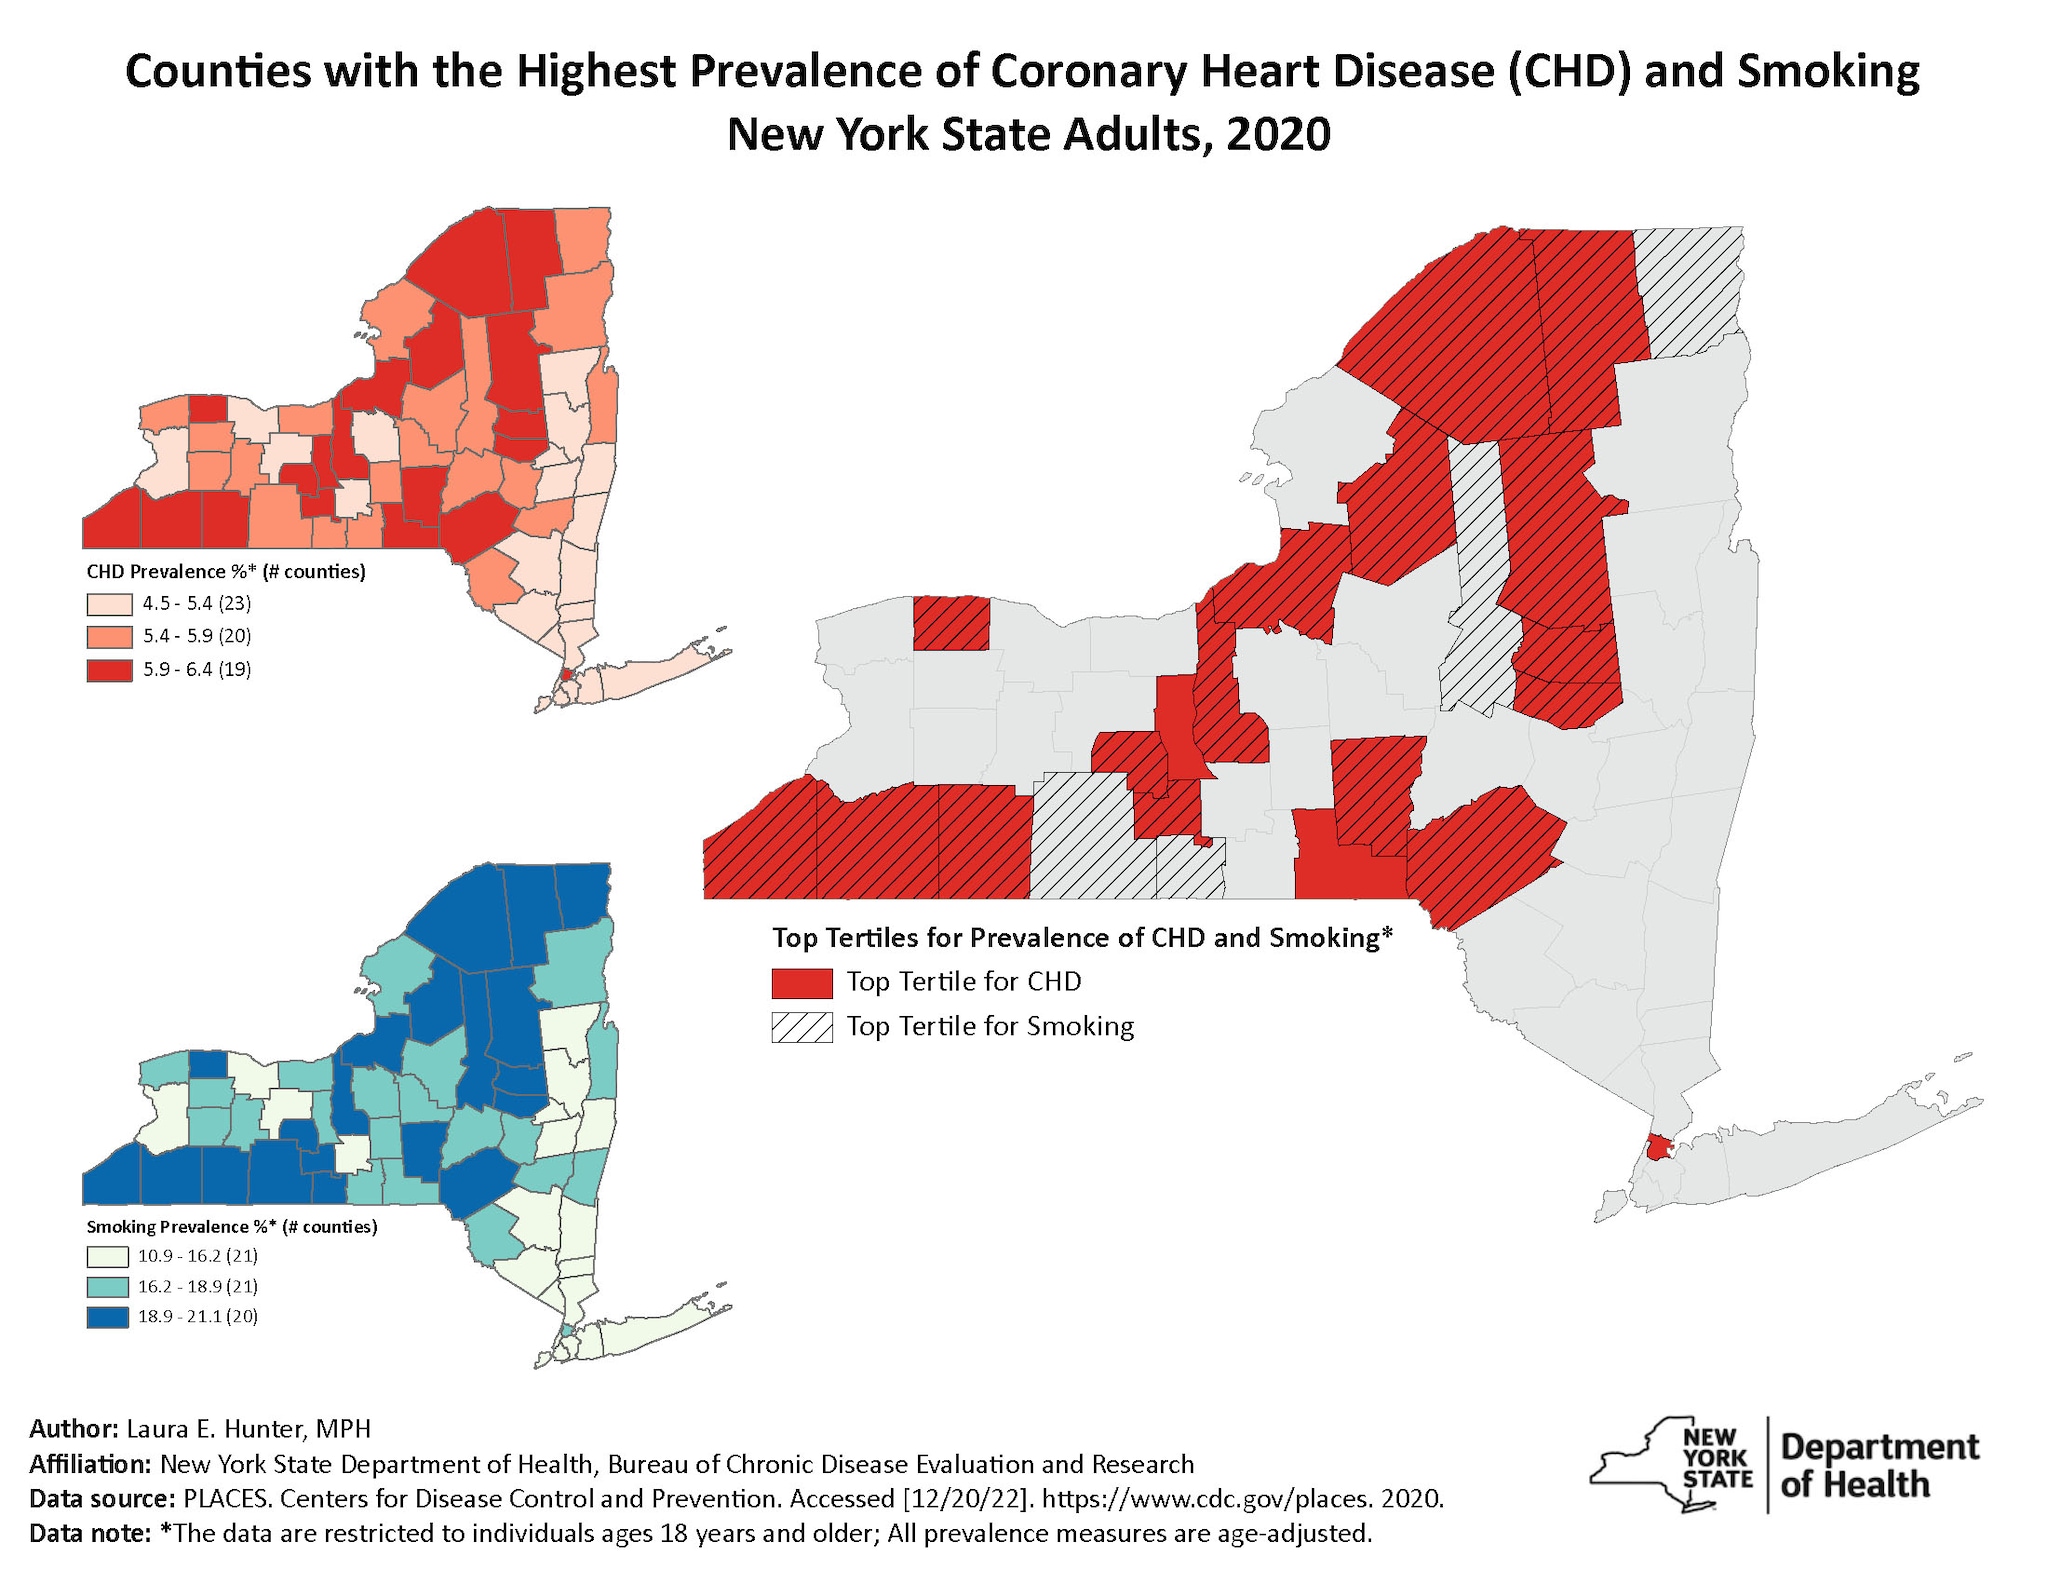
These three maps display the 2020 county-level age-adjusted prevalence of smoking status, the 2020 county-level age-adjusted prevalence of coronary heart disease (CHD), along with a map displaying counties across the state that are both high burden areas of smoking and CHD. The age-adjusted smoking prevalence ranged from 10.9%-21.1%, with 18 counties falling in the top tertile. The age-adjusted coronary heart disease prevalence ranged from 4.5%-6.4%, with 18 counties being included in the top tertile. Overall, 16 counties were in the top tertile for both smoking and CHD.
ArcGIS Pro 3.0
BRFSS/PLACES
Choropleth maps were created to display tertiles for age-adjusted prevalences of coronary heart disease (CHD) and smoking status. A 3rd choropleth map was created to display just the counties in the top tertile for CHD or smoking status, thereby identifying counties that were in the high burden categories for both CHD and smoking.
This map is targeted towards New York State Health Department (NYSDOH) officials, community partners, and supporting agencies across the state working towards the goal of reducing tobacco use, along with the prevention and mitigation of smoking-related cardiovascular disease. Specific agencies and partners will use the maps include the New York State Department of Health's Bureau of Chronic Disease Evaluation and Research (BCDER), Bureau of Tobacco Control (BTC), Bureau of Community Chronic Disease Prevention, along with numerous grantee partners of the respective state agencies. These maps identify dual high-burden areas across the state that may benefit from tailored interventions to reduce risk. This map will further be used by NYSDOH and key partners to help understand and visualize the variations in both smoking rates and related cardiovascular health outcomes across the state. These visualizations of the patterns for CHD and smoking across the state highlights the need to understand the factors contributing to high rates for both outcomes in certain regions.
Laura Elizabeth Hunter, Research Scientist I
New York State Department of Health than the Bureau of Chronic Disease Evaluation and Research
518-522-5598
laura.hunter@health.ny.gov
Laura Elizabeth Hunter, Research Scientist I, New York State Department of Health than the Bureau of Chronic Disease Evaluation and Research. Accessed from the Centers for Disease Control and Prevention's Chronic Disease Map Gallery.
