At a glance
Data sources
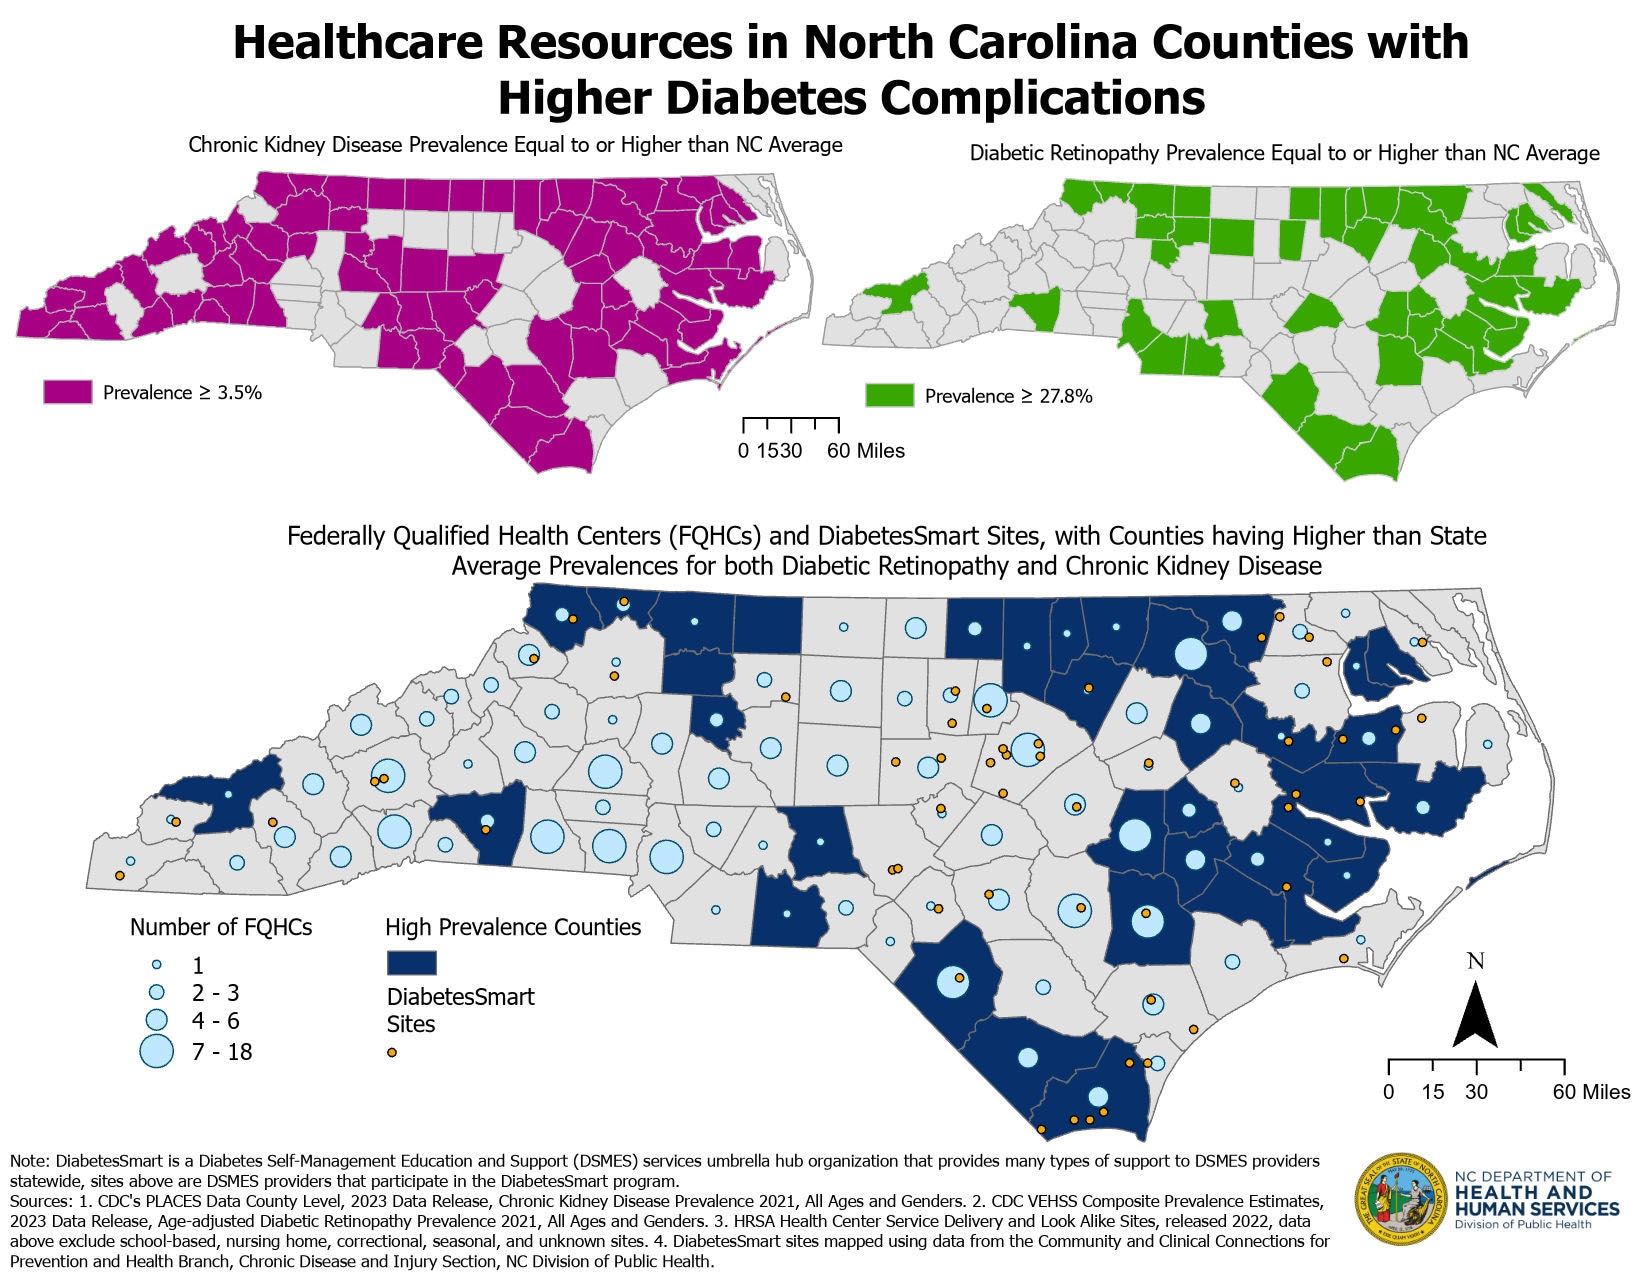
This image displays three maps, the top left highlights NC counties with chronic kidney disease prevalence equal to or greater than 3.5% among adults 18+ for the year 2021. The top right map highlights NC counties with diabetic retinopathy prevalence equal to or greater than 27.8% among adults 18+ for the year 2021. The bottom center map highlights counties with an overlap of the high prevalence rates shown in the top two maps, and it also displays the number of FQHCs in 2022 per county with graduated symbols, the range being from 0 to 18, and the map displays points for DiabetesSmart DSMES sites. The northeast corner of NC has the largest cluster of counties with high prevalences of both complications, with other smaller clusters in the southeast and northwest corners of the state. The northwest corner appears to have fewer FQHC and DiabetesSmart points.
ArcGIS
BRFSS/PLACES; Health care settings; Program services; CDC VEHSS composite prevalence estimates.
CKD and diabetic retinopathy prevalences are highlighted for counties with prevalence rates equal to or greater than the state prevalence rate. Counted and displayed overlapping counties with both equal or higher prevalences for CKD and diabetic retinopathy. FQHC data are summarized and displayed using graduated symbols. DiabetesSmart sites were geocoded to the street address and are displayed as points.
A similar map was used to identify priority regions for DP23-0020. This map will also be shared with program staff and partners for selecting counties and FQHCs to target for CKD and diabetic retinopathy detection and screening initiatives and for targeting for DiabetesSmart site recruitment.
Stacey Burgin, Community and Clinical Connections for Prevention and Health Branch, Lead Evaluator
North Carolina Department of Health and Human Services
919-638-6131
Stacey.burgin@dhhs.nc.gov
Stacey Burgin, Community and Clinical Connections for Prevention and Health Branch, Lead Evaluator, North Carolina Department of Health and Human Services. Accessed from the Centers for Disease Control and Prevention's Chronic Disease Map Gallery.

