Key points
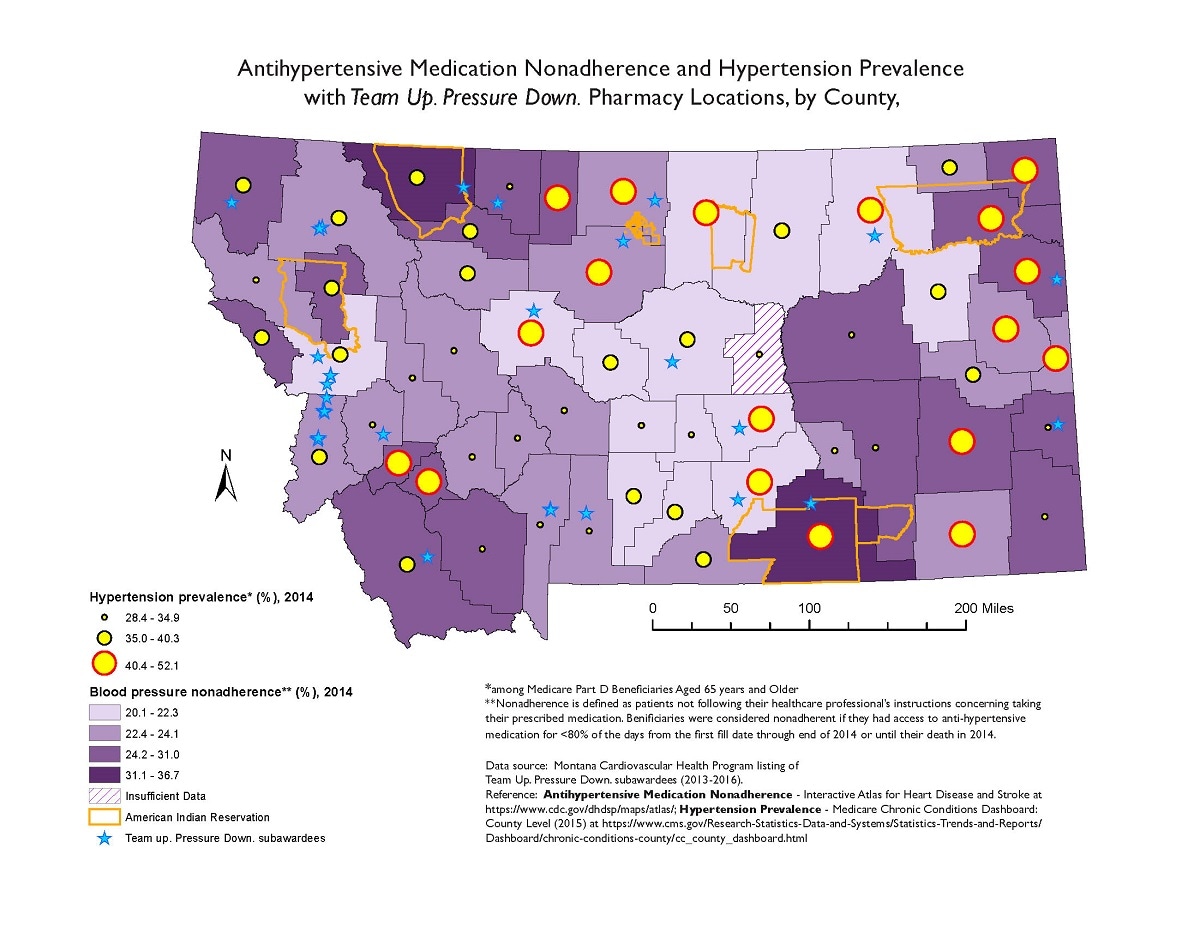
Map

Data sources
Major Findings
Poor blood pressure medication adherence can lead to poor control of high blood pressure and increases the likelihood of hospitalization and premature death. Counties in the Central Valley tend to have higher blood pressure medication nonadherence than other counties in California do. This map is a call to action to Central Valley health systems to address poor blood pressure control through improved care to reduce hospitalizations and premature mortality.
How the map will be used, or has been used
This map is the first of two maps that were shared with the Montana Cardiovascular Health Program's consulting pharmacist and the former Montana Pharmacy Association president to assist in recruiting community pharmacies to participate in the 5th year of the TUPD project. Also, after presenting this map and other medication adherence maps to the Montana Primary Care Association, potential projects were discussed for community health centers with an on-site pharmacy.
ArcGIS
Data Sources: Blood Pressure Medication Usage Among Hypertensive Patients, California Health Interview Survey, 2013–2014; Premature Hypertension-Related Mortality, California Death Statistical Master File, 2012–2014; Preventable Hypertension-Related Hospitalization, Patient Discharge Data, California Office of Statewide Health Planning and Development, 2012–2014; Medi-Cal Blood Pressure Medication Adherence, 2014; Medicare Blood Pressure Medication Adherence, CDC Interactive Atlas of Heart Disease and Stroke, 2014.
County ranks are presented on a common scale for all five maps. A choropleth-style map with nine classes was used to symbolize the spatial variation represented in each map. The first map (A) shows blood pressure medication usage among hypertensive patients (2013 to 2014) from the California Health Interview Survey. San Joaquin and Merced counties are ranked very high (having very poor hypertension medication usage). Fresno and Stanislaus are slightly below them, and Kings, Tulare, Kern, and Madera counties are ranked much lower (having better medication usage). The second map (B) displays the rate of premature hypertension-related mortality for the years 2012 through 2014. San Joaquin, Merced, and Kern counties are all within the top five California counties (having the highest mortality rates). The third map (C) displays preventable hypertension-related hospitalization for the years 2012 through 2014. All of these counties except for Madera are in the top 15 for worst hospitalization rate in California. The fourth map (D) displays blood pressure medication nonadherence among the Medicaid population. All of the counties except for Kern and Madera counties are in the top 15 for worst medication adherence in California. The final map (E) displays blood pressure medication adherence among the Medicare population. Merced, Kings, Tulare, and Kern counties are all in the top 10 for worst medication adherence in California.
Brendan Darsie, Research Scientist II, California Department of Public Health
916-324-0090
brendan.darsie@cdph.ca.gov
Brendan Darsie, California Department of Public Health. Accessed from the Centers for Disease Control and Prevention's Chronic Disease Map Gallery.
