Key points
Data sources
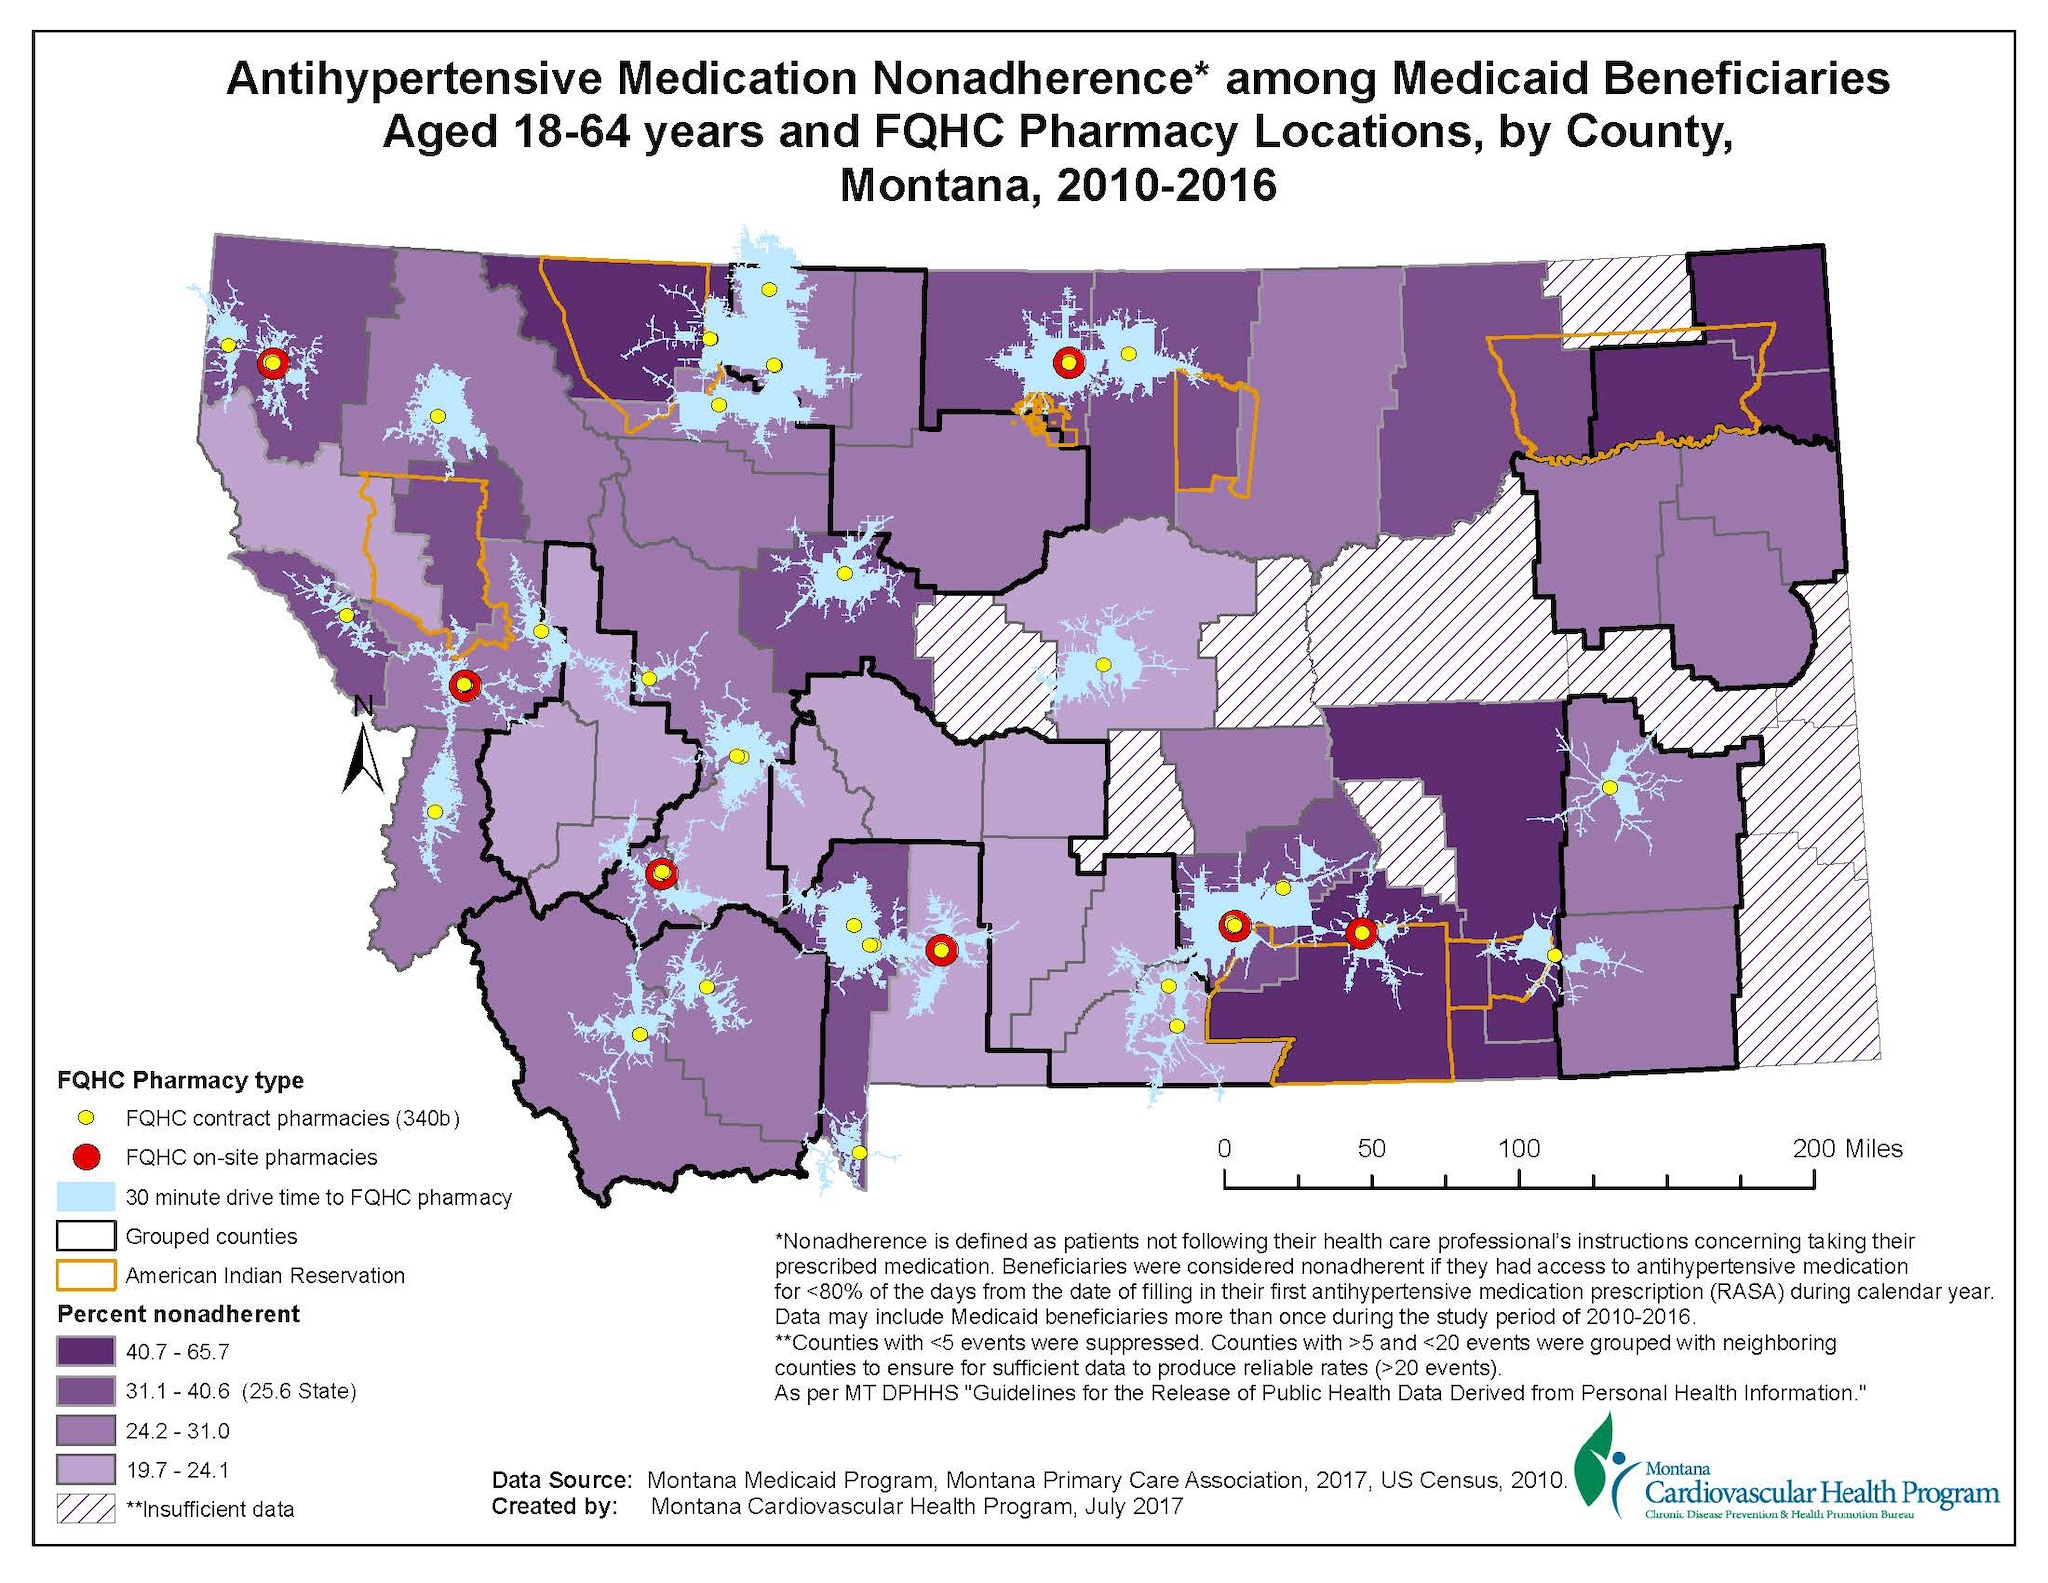
Higher nonadherence rates are concentrated around American Indian reservations with lowest nonadherence rates shown in south central part of the state. This map illustrates that approximately 13.5% of the Montana population 18-64 years below Federal Poverty Level resided within a 30 minute drive time to FQCH pharmacies.
ArcGIS 10.2.1 ESRI, SAS 9.4, ArcGIS On-line
Montana Medicaid Claims and administrative records for 2010-2016, Montana Primary Association FQHC pharmacies, 2016, US Census 2010.
The Montana Medicaid Claims data included in-state dual eligible adults aged 18-64 years with ≥2 claims in their respective drug group for hypertension (RASA). Nonadherence calculations included the denominator of a ≥180 days covered during calendar year and the numerator included the number of days covered by the prescription fills during the same time period. Beneficiaries with a proportion of days covered <80% were considered nonadherent.
Unduplicated demographics and claims files for each calendar year were linked by member id. The master file included 12,734 unique records for analysis. 32.8% of records were used to map nonadherence for blood pressure medication.
Seventeen counties (30%) with >5 and <20 records were grouped with neighboring alike counties to produce reliable rates creating seven grouped county regions. Nonadherence county data were classified and mapped using quartiles. Medicaid pharmacies and FQHC pharmacies were geocoded for mapping.
Dorota Carpendo, Epidemiologist, Montana Department of Health and Human Services
406-444-0653
dcarpenedo@mt.gov
Carpendo,D., Oser, C., Hanson, C., "Antihypertensive nonadherence and drive time to FQHC pharmacies" [Map]. October, 2017. Montana Department of Health and Human Services. Accessed from the Centers for Disease Control and Prevention's Chronic Disease Map Gallery.

