Key points
Map

Data sources
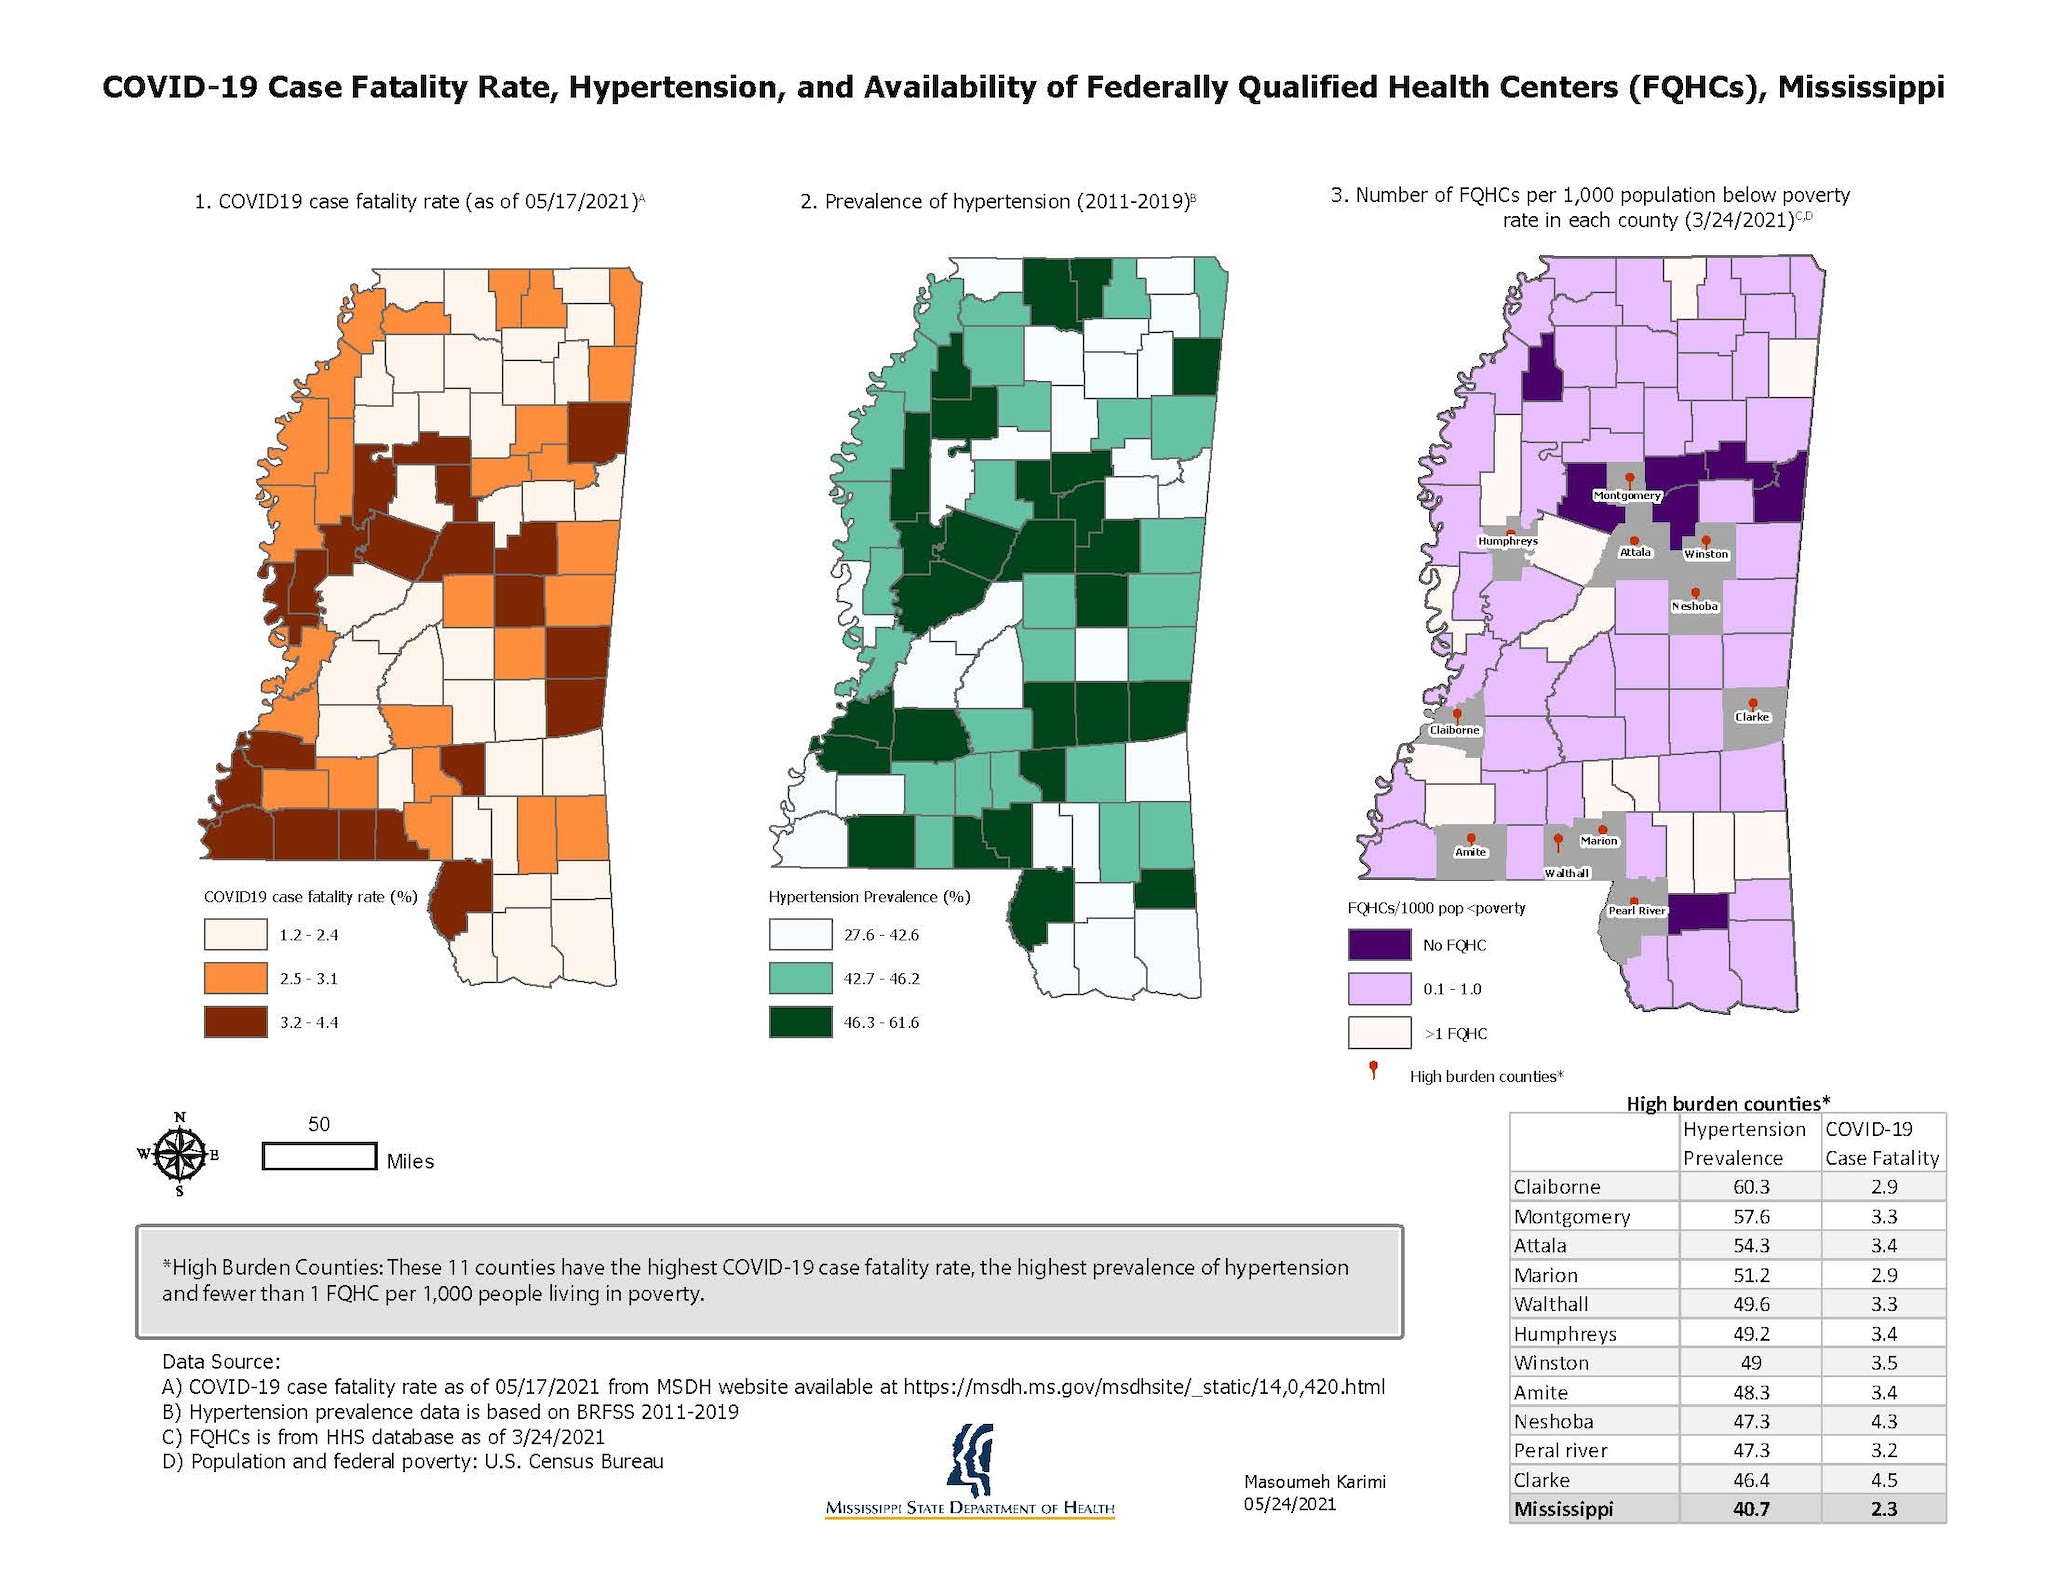
There are 11 counties that have the highest case fatality rates of COVID-19, the highest prevalence of hypertension and less than 1 FQHC per 1,000 population below the federal poverty level. This is 13% of Mississippi counties.
ArcGIS Pro
- COVID-19 case fatality rate (as of 05/17/2021): Calculated from case and death data from Mississippi State Department of Health website, available at https://msdh.ms.gov/msdhsite/_static/14,0,420.html#Mississippi
- Hypertension Prevalence: Behavioral Risk Factor Surveillance System (BRFSS) 2011-2019 analyzed by the Mississippi State Department of Health (MSDH)
- Federally Qualified Health Centers (FQHCs): U.S. Department of Health and Human Services (HHS) Dataset – FQHCs from HHS (3/24/2021)
- Population and percent of persons below the federal poverty level: U.S. Census Bureau QuickFacts, available at https://www.census.gov/quickfacts/MS
Map 1: COVID-19 Case Fatality Rate (%)
The numbers of COVID-19 deaths per county are available on the Mississippi State Department of Health website. The case fatality rate (as of 05/17/2021) is calculated as deaths divided by cases for each county, multiplied by 100 to yield a percentage. The start date for the case fatality rate is 07/18/2020. The results are displayed as tertiles using a graduated colors spectrum.
Map 2: Prevalence of Hypertension (%)
The prevalence of hypertension is 5-year BRFSS data collected every other year between 2011 and 2019 and analyzed by MSDH BRFSS statisticians. It is displayed as tertiles using a graduated colors spectrum.
Map 3: Availability of FQHCs per 1,000 persons living below the poverty level and the identification of high burden counties
Total population size and federal poverty rate data were extracted from the U.S. Census Bureau Quick Facts and the locations of FQHCs were obtained from the HHS database (as of March 24, 2021). FQHCs per 1,000 persons living below the poverty level are mapped using 3 manually-created categories with a graduated colors spectrum to identify counties with 0, 1 and more than 1 FQHCs per 1,000 population below poverty rate.
This series of maps can be used by the Office of Chronic Disease Prevention in the Mississippi Department of Health when considering where to establish more FQHCs. As a short-term plan, COVID-19 Response Team leadership at the Mississippi Department of Health can use the maps when considering where to provide more testing and vaccination sites to help reduce COVID-19 case fatality.
Masoumeh Karimi, Epidemiologist
Mississippi State Department of Health
Masoumeh.Karimi@msdh.ms.gov
Masoumeh Karimi, Mississippi State Department of Health. Accessed from the Centers for Disease Control and Prevention's Chronic Disease Map Gallery.
