Key points
Data sources
Major Findings
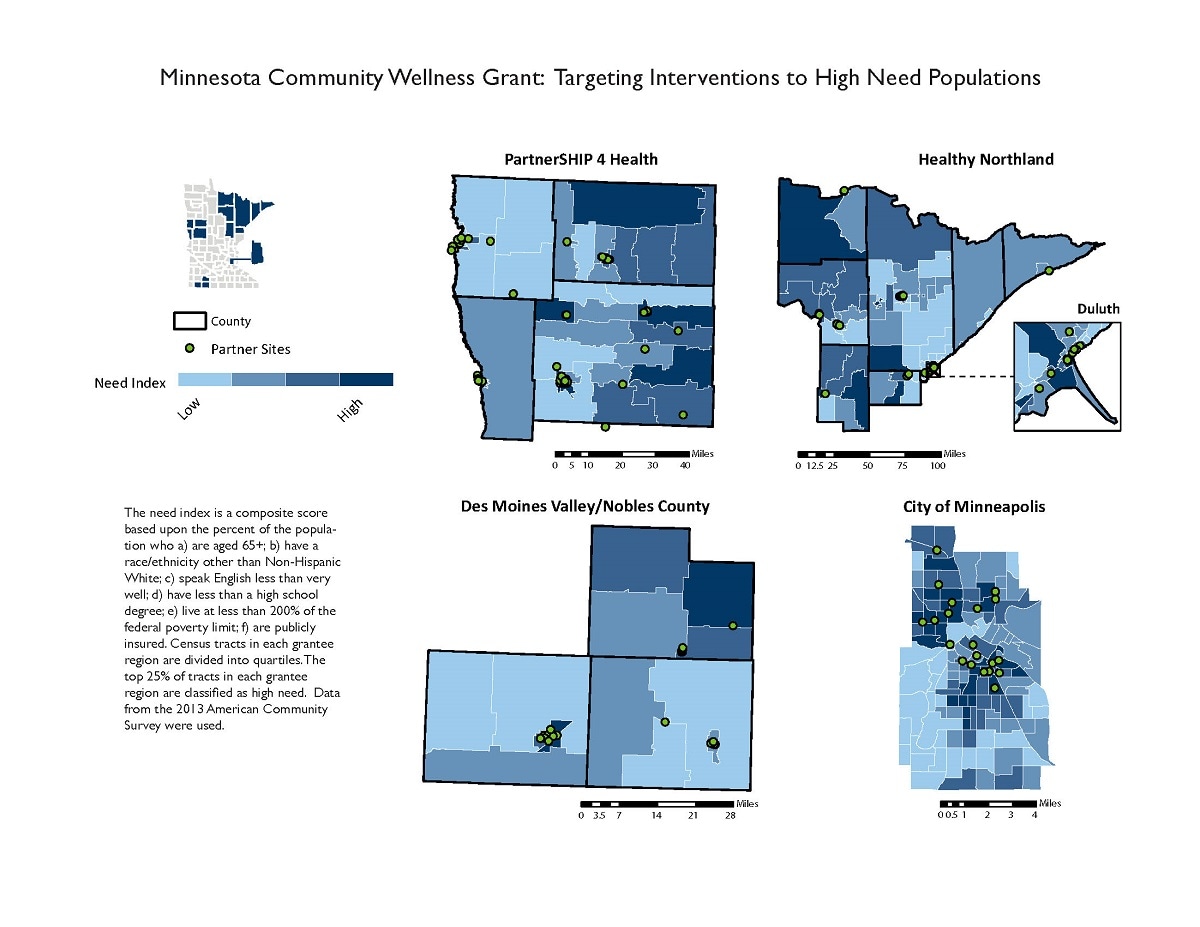
In the third year of the grant, about half of partner sites were located in high need census tracts, and more than 75% of partner sites were located in census tracts with a median-level need index. Some high need census tracts do not have any partner sites located within them yet. These areas with gaps may be targeted with future work.
How the map will be used, or has been used
This map has been used to evaluate how well subawardees have targeted priority populations and to assist subawardees in identifying gaps to plan where they might focus their work in the final year of the grant.
ArcGIS
Data from the U.S. Census Bureau’s American Community Survey (2009–2013) were used to determine high need census tracts. Policy, systems, and environmental change data collected from grant subawardees through June 2017 were used to identify intervention partner sites.
A six-part composite score was calculated from census data based upon the percentage of the population who (a) are age 65 or older; (b) have a race/ethnicity other than non-Hispanic white; (c) speak English less than very well; (d) have less than a high school degree; (e) live at less than 200% of the federal poverty level; and (f) are publicly insured. ArcGIS was used to divide census tracts into quartiles based on the score. Spatial joins were used to calculate the number of intervention sites located in high need census tracts in each region.
Emily Styles, Cardiovascular Health Unit, Minnesota Department of Health
emily.styles@state.mn.us
Emily Styles, Minnesota Department of Health. Accessed from the Centers for Disease Control and Prevention's Chronic Disease Map Gallery.

