Key points
Data sources
ArcGIS 9.3 and SAS 9.1
2004 to 2008 Michigan Resident Inpatient Files, Division for Vital Records and Health Statistics, MDCH.
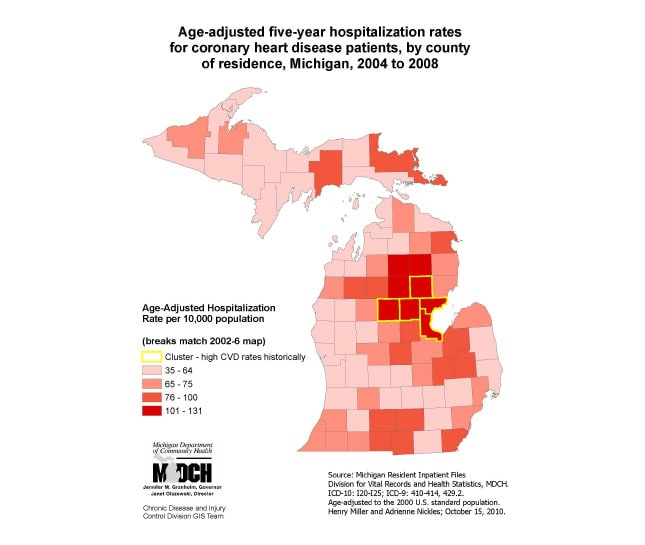
SAS used to develop county level table with hospitalization rates – Excel spreadsheet formulas used to age adjust to 2000 U.S. standard population. Excel tables converted to DBF. ArcGIS used to turn DBF tables into Michigan county level map displaying four levels of rates and outlining a five county cluster for further study and potential public health intervention.
Henry L Miller, Departmental Specialist, Michigan Department of Community Health
(517) 335-8779
millerhenry@michigan.gov
Age-adjusted five-year hospitalization rates for coronary heart disease patients, by county of residence, Michigan, 2004 to 2008 Miller, Henry; Nickles, Adrienne; Michigan Department of Community Health, [TODAY’S DATE]. Accessed from the Centers for Disease Control and Prevention's Chronic Disease GIS Map Gallery.

