Key points
Map

Data sources
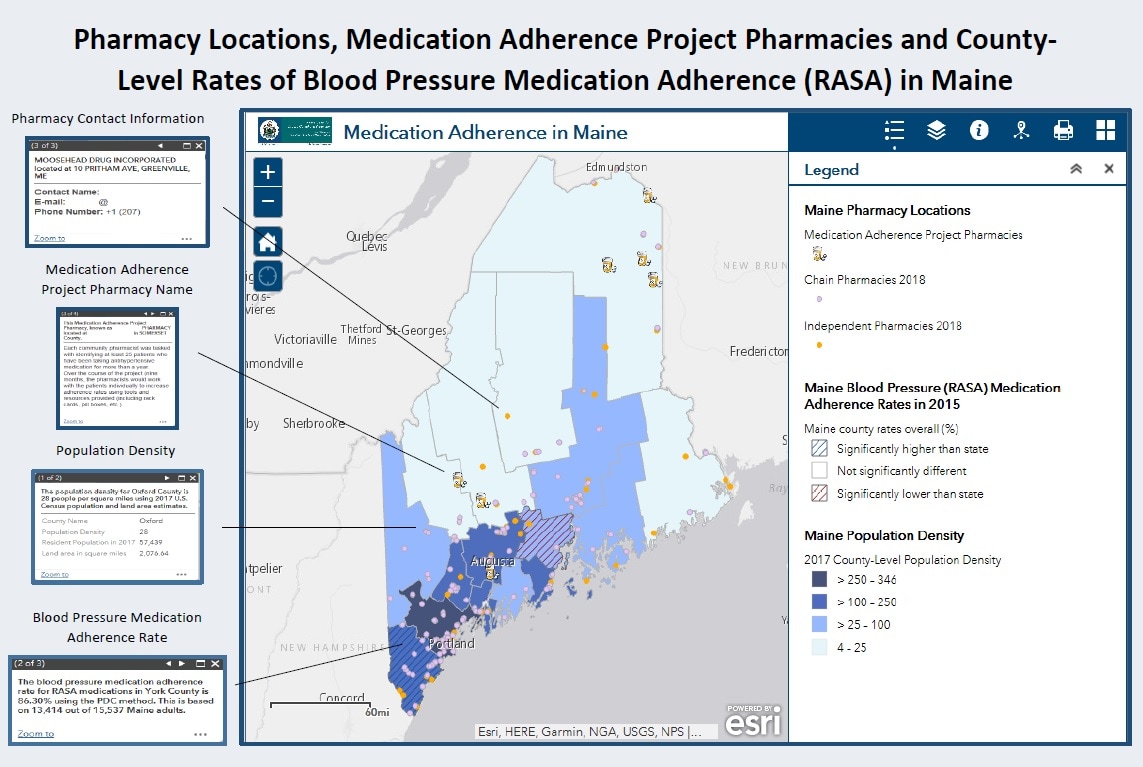
Identify: Counties with significantly lower rates of blood pressure medication adherence among all Maine counties.
Assess: Locations of all chain and independent pharmacies, Medication Adherence Project pharmacies, and county-level population density.
Act 1: Determine if county-level blood pressure medication adherence rates were higher or lower in counties with Medication Adherence Pharmacies.
Act 2: Determine counties to target for future program interventions with pharmacies. Future interventions may include partnering for self-measured blood pressure (SMBP), lifestyle change programs, or telehealth, and may be tailored based on population density. For instance, SMBP and telehealth may be more beneficial in counties with lower population density, as in-person lifestyle change programs may be less effective if the patient needs to drive more frequently to the retail pharmacy. Using a combined approach in counties with medium to high population density may see a high proportion of Mainers with improved health outcomes.
ArcGIS Online and ArcGIS Pro
2018 Licensed Pharmacy Locations: Maine Department of Professional and Financial Regulation Database; Medication Adherence Project Pharmacy Locations: Partnerships for Health and the Division of Disease Prevention, Maine CDC; Blood Pressure Medication Adherence Rates: Maine Health Data Organization’s All-Payer Claims Database (APCD); 2017 Population Density: U.S. Census Land Estimates & American Community Population Survey Estimates
County-level population density (total county population divided by land area in square miles) is displayed using four manual breaks of residents per square mile (4–25; >25–100; >100–250; >250–346). County-level medication adherence rates (calculated using the PDC method) were presented using hatched symbology to show counties with statistically higher or lower medication adherence rates. Statistical significance was determined by comparing county 95% confidence intervals (CIs) to the state rate (85.5%; 95% CI: 85.3–85.7). Non-overlapping CIs were considered statistically different. Pharmacies are denoted with icons; the prescription bottle icon represents Medication Adherence Project Pharmacies; a purple dot represents registered chain pharmacies; and an orange dot represents registered independent pharmacies. ArcGIS Pro and ArcGIS Online were used to produce this interactive map, with support from the Maine Office of GIS.
Caitlin Pizzonia, Epidemiologist, University of Southern Maine and Maine Center for Disease Control and Prevention
207-287-4102
caitlin.pizzonia@maine.edu
Caitlin Pizzonia, University of Southern Maine and Maine Center for Disease Control and Prevention. Accessed from the Centers for Disease Control and Prevention's Chronic Disease Map Gallery.
