At a glance
Data sources
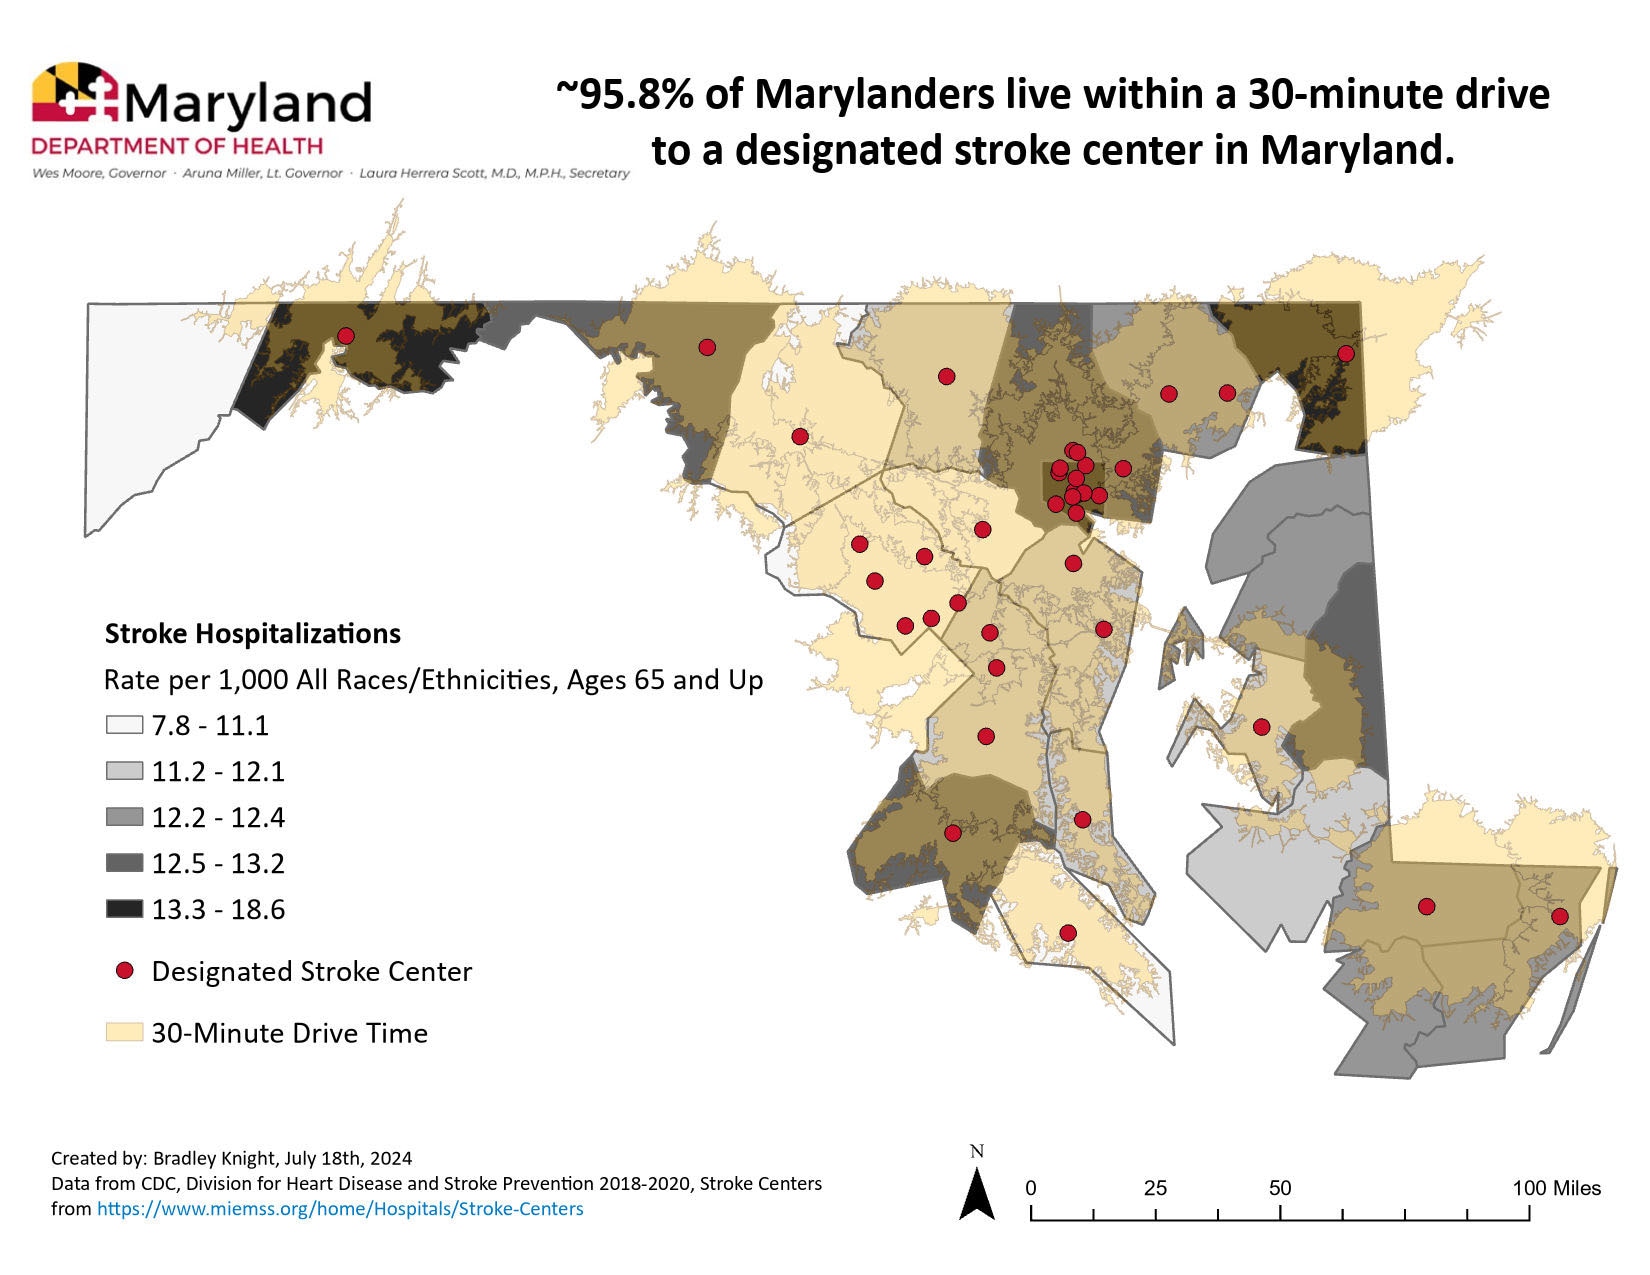
This map displays county-level stroke hospitalization rates per 1,000 persons for all populations aged 65 and up for the years 2018 to 2020 in Maryland. Much of the eastern shore and southern counties are in the higher quantiles, along with some of the western counties. The capital region has some of the lowest rates of stroke hospitalization. The areas with the highest rates were Baltimore city (16.4 per 1,000), Allegany county (18.6 per 1,000), and Cecil county (13.3 per 1,000). The areas with the lowest rates were Frederick county (9.2 per 1,000), Howard county (9.0 per 1,000), and Montgomery county (7.8 per 1,000).
The map also shows the location of designated stroke center locations, along with a shaded polygon area around them depicting anywhere within a 30-minute drive time. This encompasses much of the map, with some rural areas on the eastern shore and western counties being outside of this drive time.
ArcGIS Pro
CDC's Atlas of Heart Disease and Stroke; Hospitalization Data; U.S. Census.
Stroke hospitalization rates were displayed using quantiles. Geocoding of the designated stroke center facilities was performed manually, and a service area network analysis was performed afterwards to generate 30-minute drive time polygons from the facility locations. Population weighted centroids were produced and used to determine the estimated population that falls within the drive time polygons.
This map will likely be shared on various locations within the MDH website, such as on the Center for Chronic Disease Prevention and Control or on the Maryland Institute for Emergency Medical Services Systems.
Bradley Knight, Epidemiologist II
Maryland Department of Health
410-767-5599
Bradley.knight@maryland.gov
Bradley Knight, Epidemiologist II, Maryland Department of Health. Accessed from the Centers for Disease Control and Prevention's Chronic Disease Map Gallery.

