Key points
Data sources
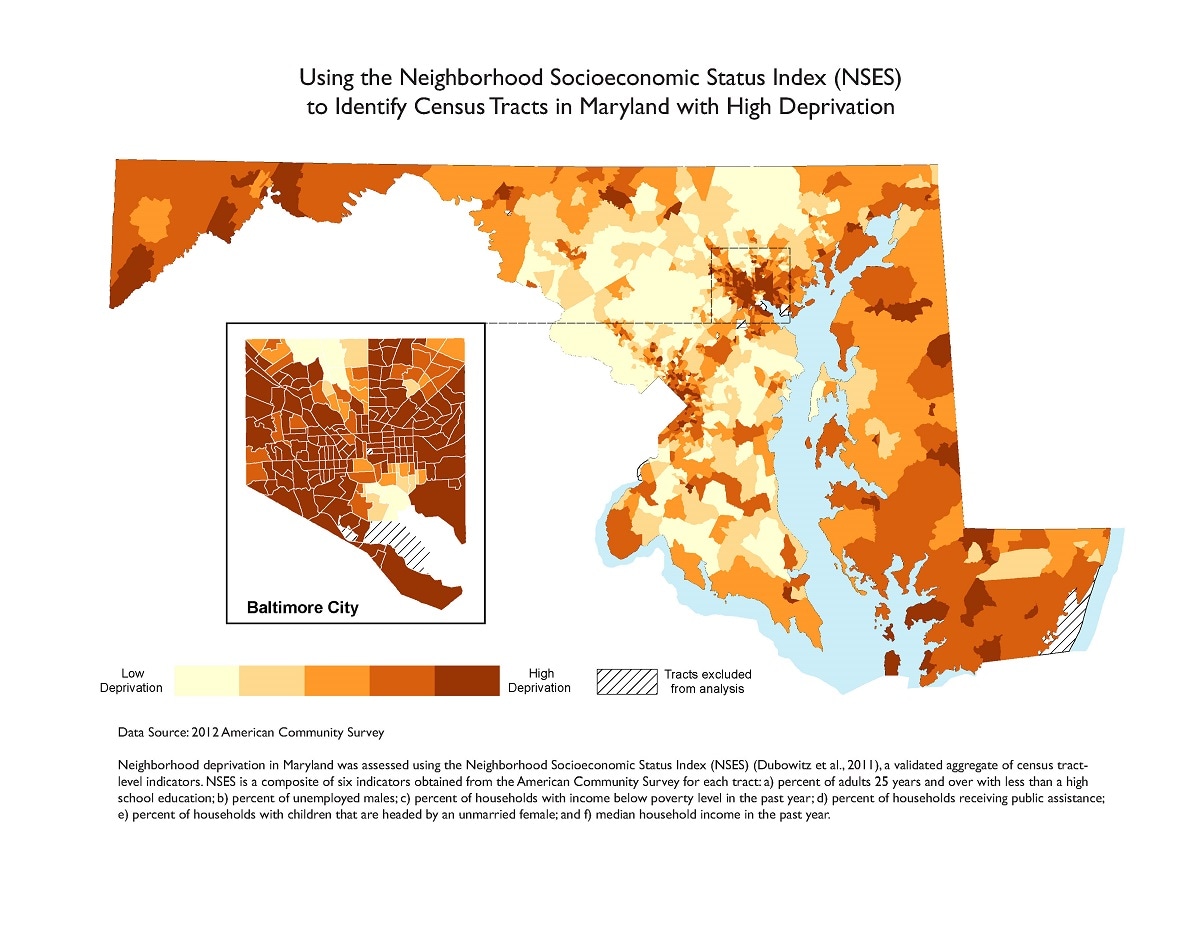
Western Maryland, the Eastern Shore, and Baltimore City have the highest levels of neighborhood deprivation.
This map provides important insight into the location of vulnerable populations.
ArcGIS 10.5
American Community Survey, 2012
Neighborhood deprivation in Maryland was assessed using the Neighborhood Socioeconomic Status Index (NSES) (Dubowitz et al., 2011), a validated composite of the following indicators: (a) percentage of adults 25 and older with less than a high school education, (b) percentage of unemployed males, (c) percentage of households with income below poverty level in the past year, (d) percentage of households receiving public assistance, (e) percentage of households with children that are headed by an unmarried female, and (f) median household income in the past year. Neighborhood deprivation was mapped at the census tract level based by quantile, with the darkest areas representing the highest neighborhood deprivation across the six measures.
Kristi Pier, Director, Center for Chronic Disease Prevention and Control, Maryland Department of Health
410-767-6722
kristi.pier@maryland.gov
Kristi Pier, Maryland Department of Health. Accessed from the Centers for Disease Control and Prevention's Chronic Disease Map Gallery.

