Key points
Map

Data sources
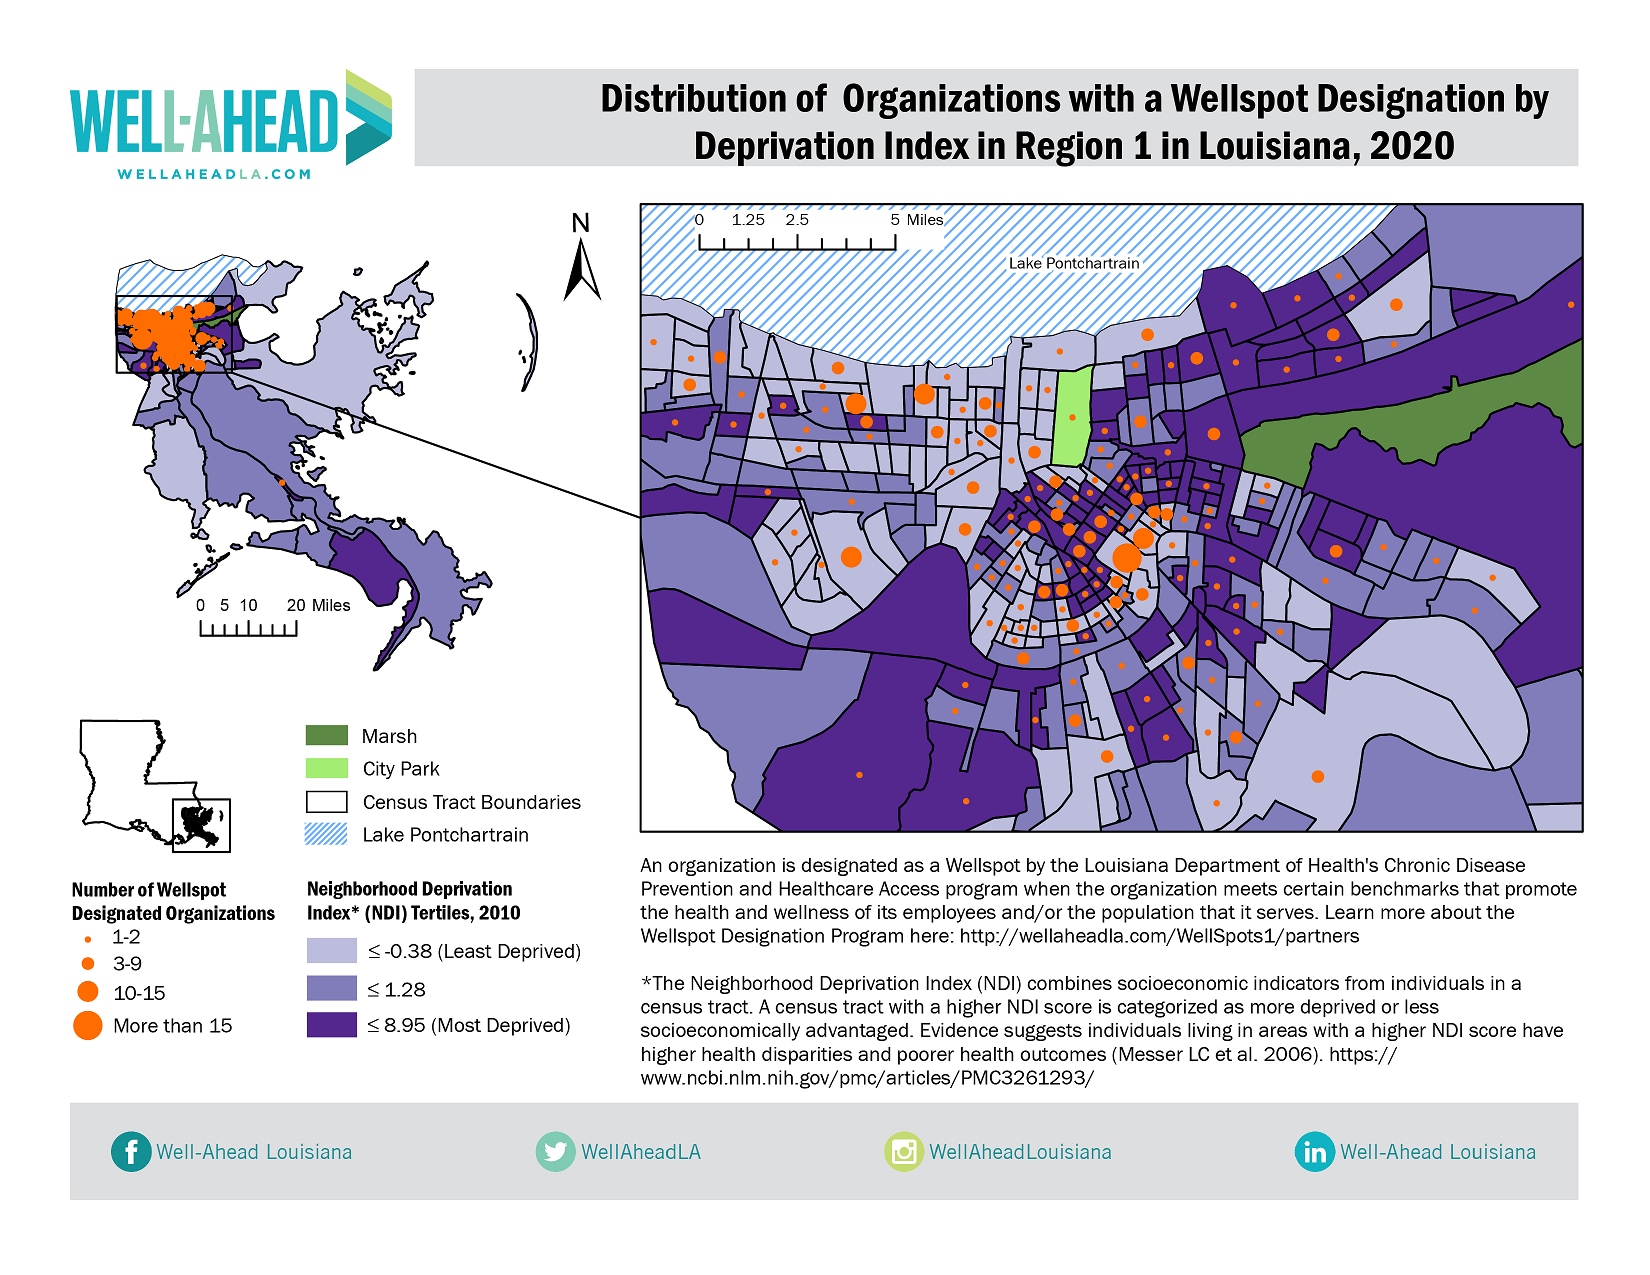
This map displays the census tracts in Public Health Region 1 in Louisiana and the associated Neighborhood Deprivation Index (NDI) tertiles for each tract. Different tertiles are represented with different colors, with lightest color representing tracts in the lowest tertile or least deprived and the darkest color representing tracts in the top tertile or most deprived. An inset map of the Greater New Orleans (GNO) area is provided to clearly show the smaller tracts. The majority of census tracts in the top tertile of the NDI, or most deprived, are in the GNO area. Organizations with a Wellspot designation are aggregated by census tract and represented by a symbol proportional to the number of Wellspots in the census tract. Half of the census tracts in Region 1 have at least one Wellspot. Of the tracts with Wellspots, 36.4% are in the top tertile. All census tracts with 10 or more Wellspots are in the lowest tertile, or least deprived tracts.
Organizations are designated as Wellspots after working with a Wellspot representative to meet wellness benchmarks that promote healthy behaviors and choices for employees and/or the populations served by those organizations. Half of the census tracts in Region 1 have at least one Wellspot. Of tracts with Wellspots, 36.4% are in the top tertile of the NDI (most deprived). Of all census tracts in the top tertile, 45% have no Wellspots, 25% have 1 Wellspot, and none of the tracts in the highest tertile have 10 or more Wellspots. Of the census tracts in the lowest tertile (least deprived): 48% have no Wellspots, 19% have 1 Wellspot, and 5% have 10 or more Wellspots. All census tracts with 10 or more Wellspots are in the lowest tertile.
ArcGIS Pro
Neighborhood Deprivation Index; list of organizations designated as Wellspots from the Louisiana Department of Health Division of Healthy Communities.
The neighborhood deprivation index (NDI) was created to measure exposure to social correlates of health and is shown in tertiles using the cholorpleth function. Information on the methodology used for the NDI can be found here: https://pubmed.ncbi.nlm.nih.gov/17031568/. Wellspots were aggregated by census tract and shown using symbols proportional in size to the number of Wellspots in each census tract. This map was created using ArcGIS Pro.
This map is the first in a series, which will include a map for each of the nine public health regions in Louisiana. These maps will be used to evaluate the equity of the Wellspot Designation Program and help inform Wellspot representative outreach activities. Subsequent maps will explore population density and the spatial distribution of Wellspot sites.
Dayaamayi Kurimella, Epidemiology Manager
Well-Ahead Louisiana
Dayaamayi.Kurimella@la.gov
Dayaamayi Kurimella, Well-Ahead Louisiana. Accessed from the Centers for Disease Control and Prevention's Chronic Disease Map Gallery.
