At a glance
Map
Data sources
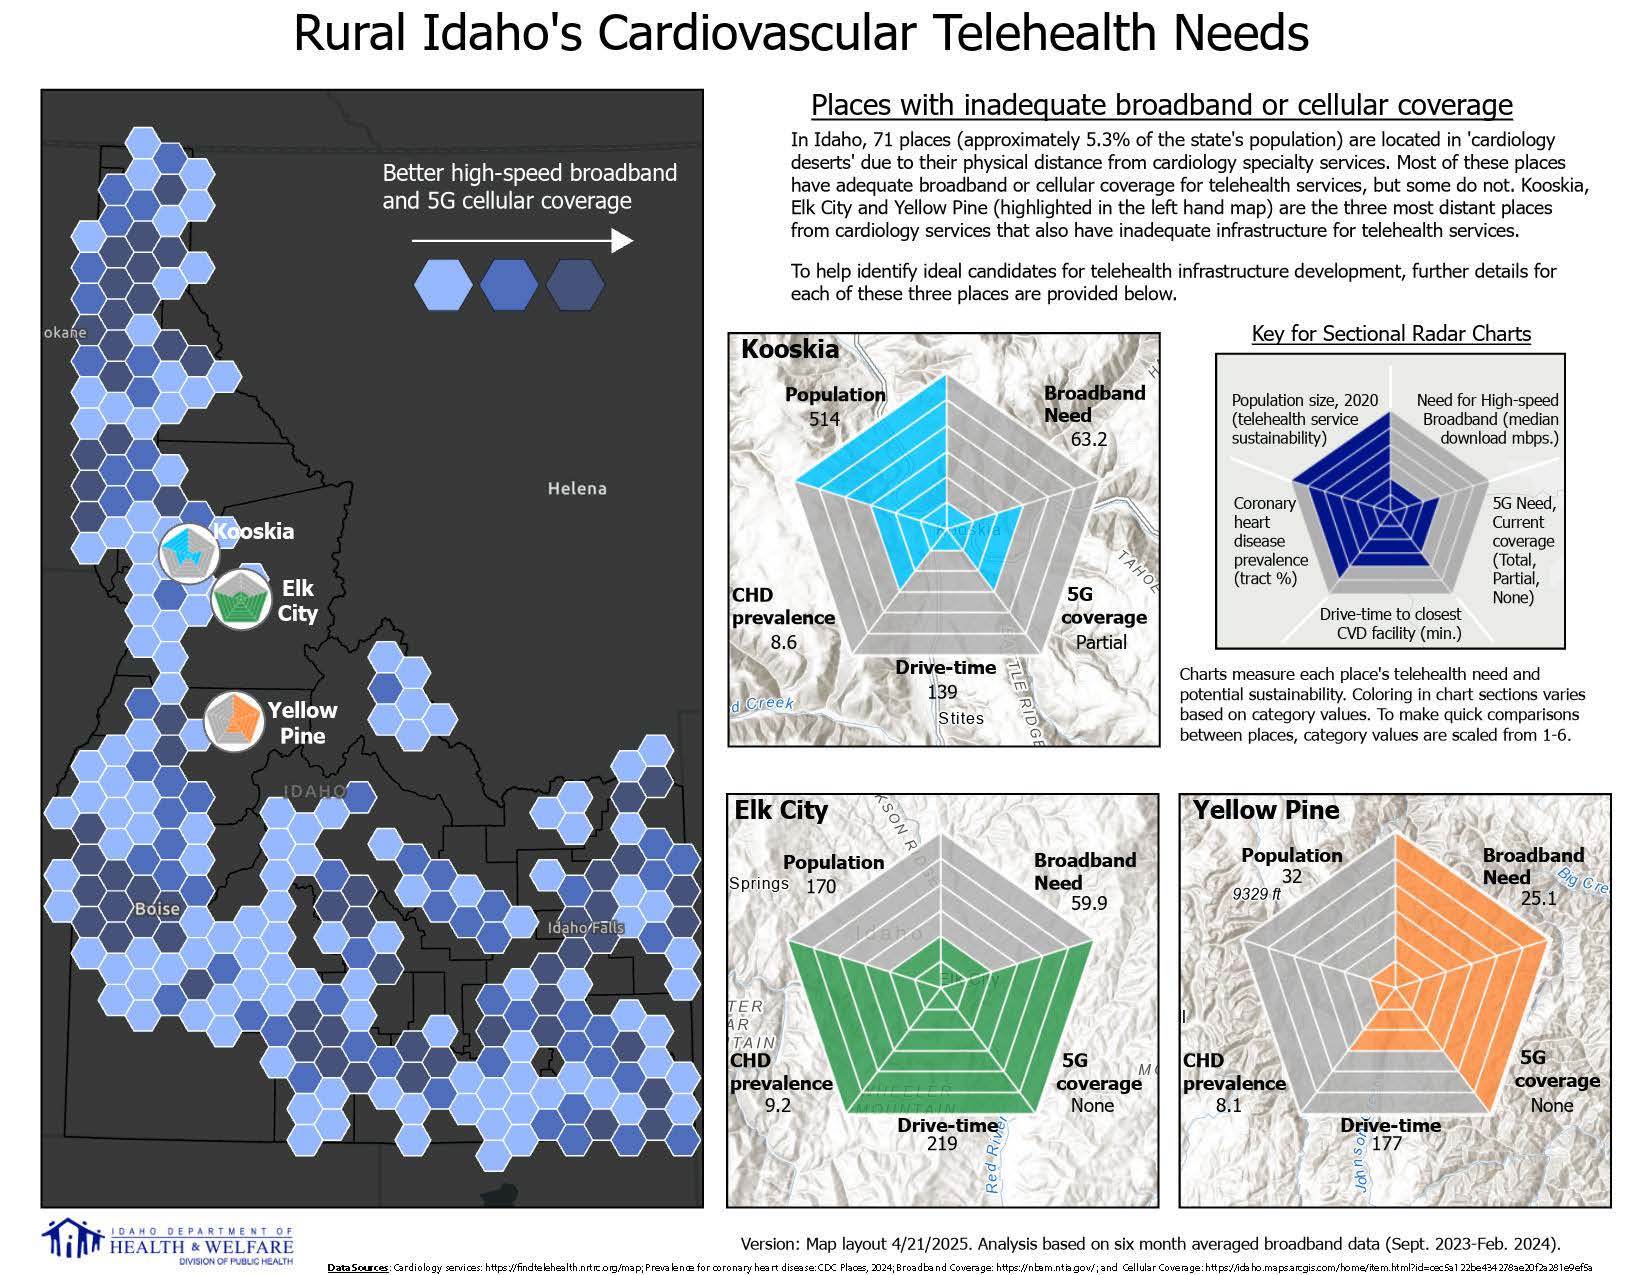
This series of maps depicts cardiovascular telehealth needs in rural Idaho. A large map on the left displays the state of Idaho along with color-coded hexagons indicating a gradient of high-speed broadband and 5G cellular coverage. Three places are highlighted in this map with color-coded chart symbols. Inset maps of each of the three places are depicted on the right.
Each inset map includes hexagon shaped geographic charts centered over the respective town/census designated place. A key indicates that the charts measure each place’s telehealth need and potentially sustainability (for telehealth services). All values in the charts have been scaled from 1-6.
The charts have five sections. Moving clockwise from twelve o’clock, these sections are: ‘need for high-speed broadband (based on median download mbps)’; ‘5G need, based on current coverage (coverage categories are Total, Partial or None)’; ‘drive-time to closest CVD specialty facility (in minutes); ‘coronary heart disease prevalence (based on percentage by tract); and ‘2020 population size’. The charts indicate that all three places are well over two hours from physical cardiology specialty services, have insufficient broadband speeds and 5G coverage for telehealth services, and that the coronary heart disease prevalence of each place are nearly within one percentage point of one another.
However, the rural place with the largest population is also the closest of the three to cardiology services and has both better median broadband speed and 5G coverage. The remaining two places have markedly smaller populations and generally worse median broadband and 5G coverage. Policy makers will need to weigh these trade-offs critically to determine where to invest in rural telehealth infrastructure.
ArcGIS Pro
BRFSS/PLACES; Health care locations; Program services; Broadband and cellular coverage data.
High-speed broadband and 5G cellular coverage data were aggregated to 200 square-mile hexagons. Geographic Sectional Radar charts were created for a selection of cities/towns located more than a 30-minute drive time from physical cardiovascular services and having inadequate high-speed broadband or 5G cellular coverage (for telehealth services). Scaled values of telehealth need and sustainability data were used in radar charts to make quick comparisons regarding candidates for future telehealth infrastructure development.
The purpose of the map is to help policy makers prioritize areas to build telehealth infrastructure capacity.
Robert Graff, Chronic Disease Epidemiology and Surveillance Director
Idaho Department of Health and Welfare
robert.graff@dhw.idaho.gov
208-866-6811
Robert Graff, Idaho Department of Health and Welfare. Accessed from the Centers for Disease Control and Prevention's Chronic Disease Map Gallery.