Key points
Map

Data sources
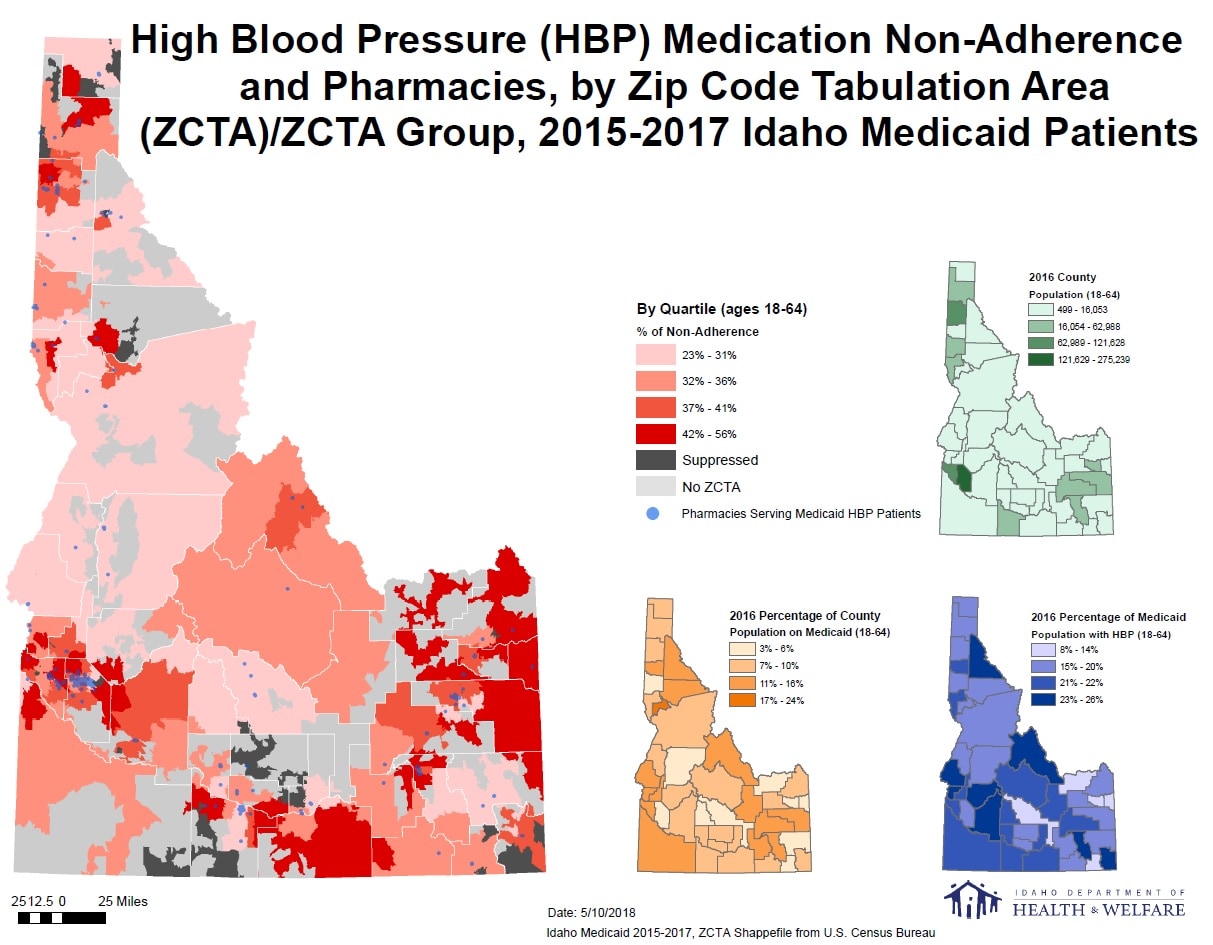
Estimates of health behaviors and/or conditions in rural areas of Idaho are frequently suppressed due to either statistical unreliability or potential for breaches in confidentiality. This map overcomes these issues by (1) aggregating over time and (2) aggregating over space in rural areas of the state to create rural ZCTA groups. The map indicates variable but elevated rates of non-adherence within the state’s population centers (as indicated by clustering of pharmacy locations), with higher rates frequently seen in adjoining rural areas. Improving access to effective services within Idaho population centers can positively impact overall Medicaid non-adherence rates. However, this map suggests that abundant opportunities to improve non-adherence rates also exist outside of the state’s metro areas.
These maps provide base-level understanding of access to blood pressure medication in relation to medication non-adherence rates. As a result of these maps, the Idaho Division of Public Health Heart Disease and Stroke Prevention Program plans to work with the Idaho State University College of Pharmacy to conduct statewide assessment of pharmacy services with the state.
ArcGIS Desktop 10.4.1
Idaho Medicaid, Census ZIP Code Tabulation Areas (ZCTA) shapefiles
High blood pressure medication non-adherence was estimated by proportion of days covered (following “CALCULATING PROPORTION OF DAYS COVERED [PDC] FOR ANTIHYPERTENSIVE AND ANTIDIABETIC MEDICATIONS: AN EVALUATION GUIDE FOR GRANTEES”). Non-adherence estimates were classified using a quantile classification scheme. ZCTA groups were made manually using population weighted centroids and location of incorporated cities as guidance for creating meaningful groupings.
Robert Graff, Chronic Disease Epidemiologist, Idaho Department of Health and Welfare
208-334-6521
robert.graff@dhw.idaho.gov
Robert Graff, Idaho Department of Health and Welfare. Accessed from the Centers for Disease Control and Prevention's Chronic Disease Map Gallery.
