Key points
Data sources
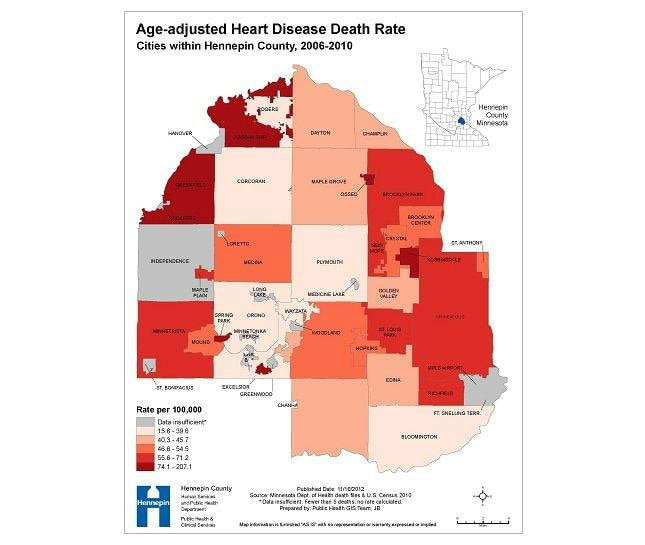
Color coding may enable health workers to identify trouble spots within their jurisdiction and to focus interventions on these areas. However, any such effort should be undertaken with the awareness that some rate estimates are quite unstable, given the small number of heart disease deaths occurring within certain municipalities. In practice, the comparatively small number of events in local jurisdictions often precludes further investigation of disease occurrence at higher "resolution", e.g., census tract.
As a result, trends or problem foci occurring at the sub-municipal level may go undetected. In the face of such small numbers it can be advantageous, or even crucial, to examine disease occurrence data from more than one perspective. For example, pairing this map with the accompanying Heart Disease Death Kernel Density map may provide a more comprehensive, better-rounded interpretation of the distribution of heart disease occurrence in a given area.
The purpose of this map was to show the geographic variations in heart disease death occurrence; to inform local health department management, program staff, and relevant community groups and organizations of the burden of heart disease and to guide and monitor the focus of public health intervention.
Arc GIS 10
Minnesota Department of Health annual death files, 2006-2010; 2010 US Census municipal boundaries with populations.
The location of heart disease deaths was determined by geocoding address information and aggregating point locations to Hennepin County cities. Age-adjusted death rates were calculated for each municipality in the County and the Fort Snelling Territory using the death files for 2006-2010 from the Minnesota Department of Health and the 2000 US Standard Million Population. No death rate was calculated for any municipality in which fewer than five deaths occurred.
Jack Brondum, Epidemiologist, Hennepin County Human Services and Public Health Department (HSPHD)
(612) 543-5219
Jack.Brondum@co.hennepin.mn.us
Age-adjusted Heart Disease Death Rate: Cities within Hennepin County, 2006-2010 Jack Brondum, HSPHD; Jay Meehl, GIS Program Coordinator. Accessed from the Centers for Disease Control and Prevention's Chronic Disease Map Gallery.

