Key points
Data sources
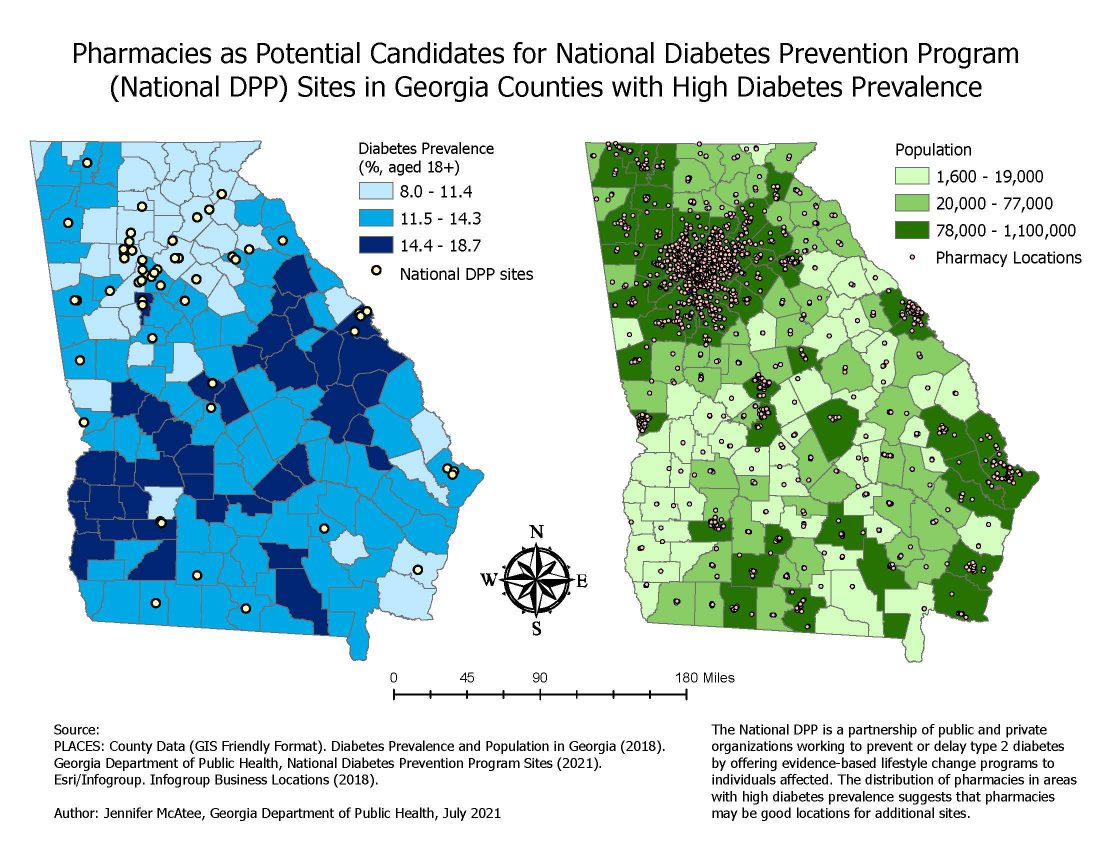
More time and resources need to be devoted to southern areas of the state with higher diabetes prevalence, especially areas with no DPP sites which also tend to be located in the southern region.
ArcGIS Pro
Map 1: PLACES: County Data (GIS Friendly Format). Diabetes Prevalence and Population in Georgia (2018) & Georgia Department of Public Health, National Diabetes Prevention Program Sites (2021). Map 2: PLACES: County Data (GIS Friendly Format) & Esri/Infogroup. Infogroup Business Locations (2018).
For Map 1, I used a shape file to display county-level diabetes prevalence and National Diabetes Prevention Program (National DPP) sites. Diabetes prevalence is displayed in quartiles, represented as graduated shades of blue. The two middle quartiles were combined to form three total categories of diabetes prevalence. Point-based data identifying National DPP sites are represented in yellow. For Map 2, I used a shape file to display Georgia counties by population in graduated shades of green and point-based data to identify pharmacy locations in pink. Population was separated into quintiles. Due to extreme differences in population distribution within the state, the first two quintiles were combined to form the low population category, the next two were combined to form the middle category, and the final quintile represents the high population category.
This map will be used in discussion with both existing and future partners as the Diabetes Program attempts to further expand our reach outside of Metro-Atlanta and into areas of the state with higher diabetes prevalence. This visualization helps us see what areas we should target for partnerships and future DPP sites.
Jennifer McAtee, Epidemiologist
Georgia State Department of Health
Jennifer.McAtee@dph.ga.gov
Jennifer McAtee, Georgia State Department of Health. Accessed from the Centers for Disease Control and Prevention's Chronic Disease Map Gallery.

