Key points
Data sources
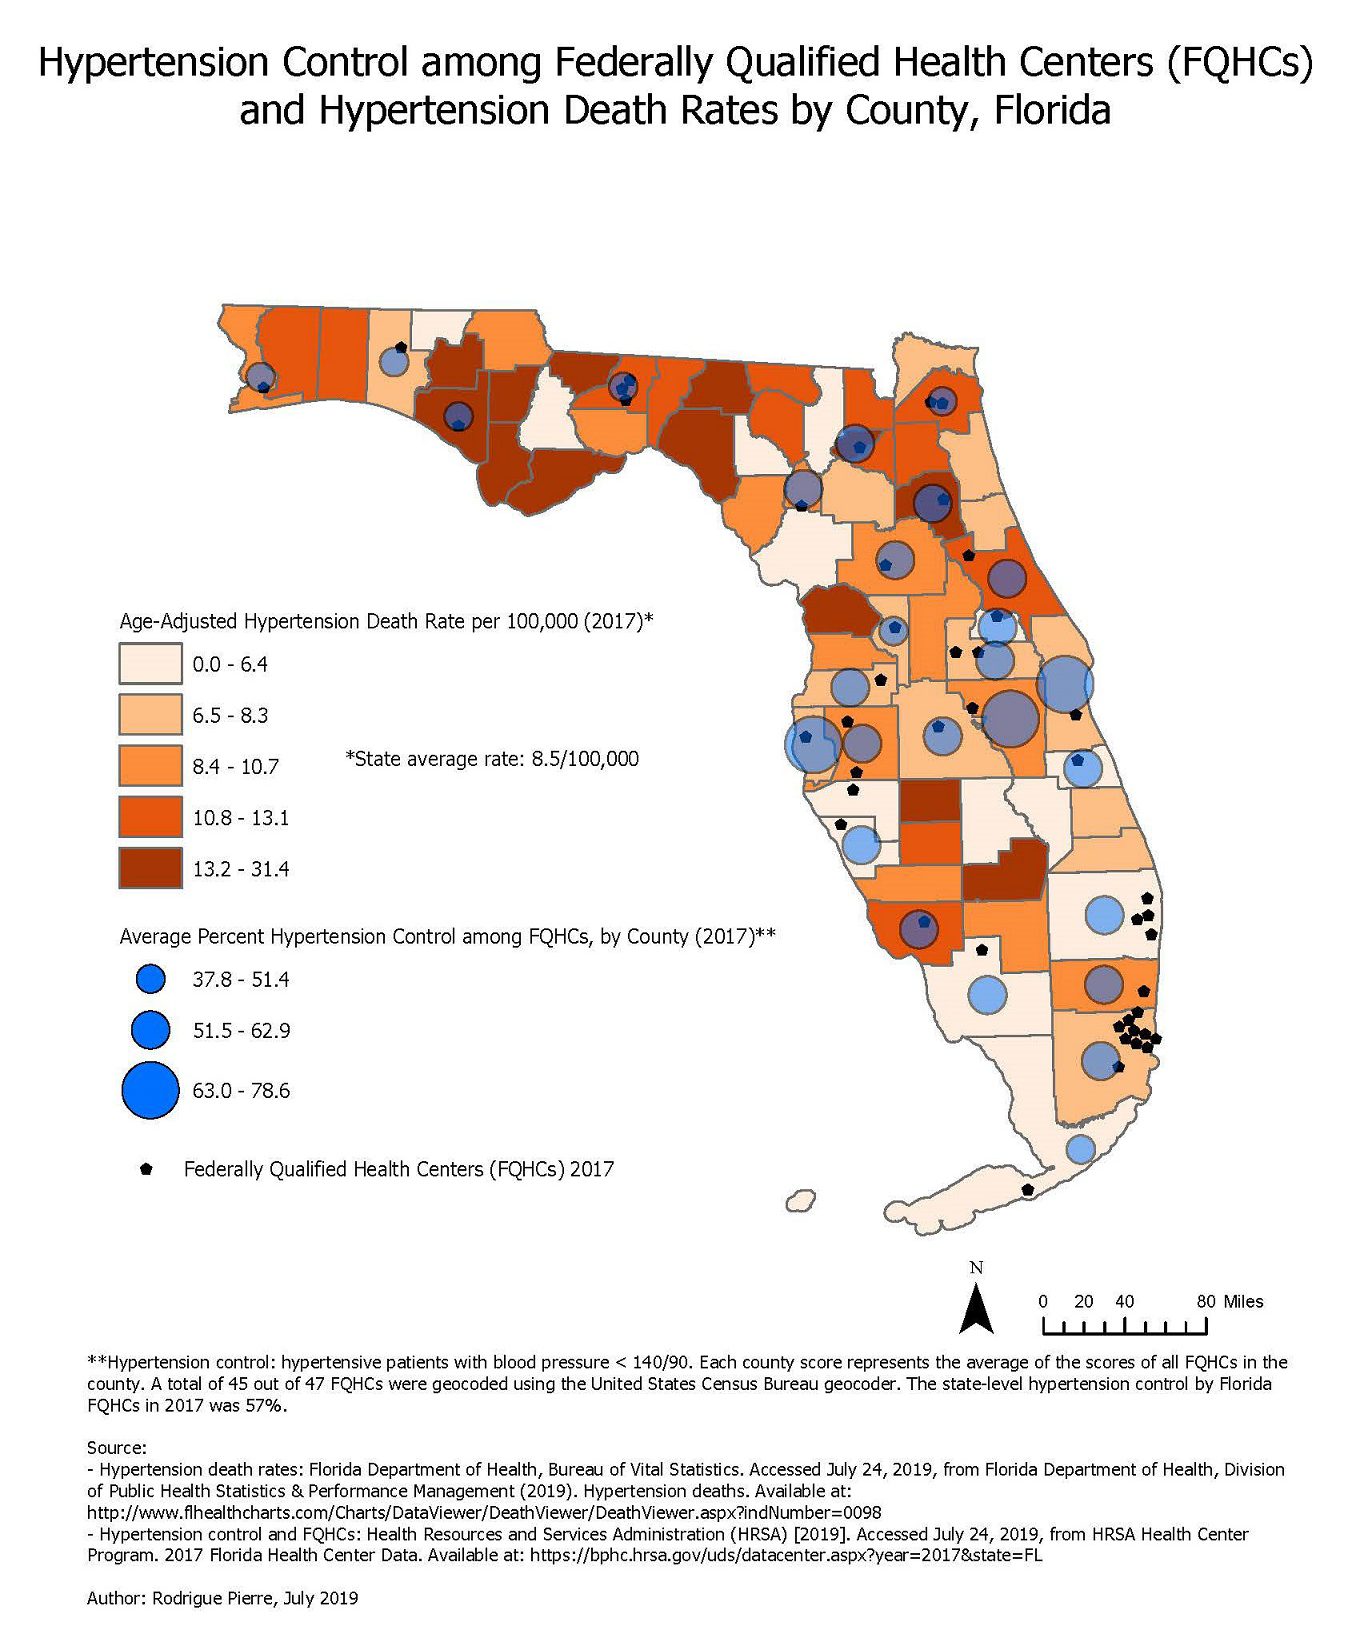
A total of 27 of the 67 Florida counties (40.30%) had the main addresses of the 47 FQHCs distributed within their respective geographic limits in 2017. Many counties with the highest rates of hypertension death rely on services from FQHCs located in neighboring counties.
On average, Florida FQHCs achieved 57% hypertension control statewide in 2017.
The lowest hypertension control scores (i.e., bottom tertile 37.8% – 51.4%) were seen primarily among FQHCs located in counties of the northern regions of the state. Often, these counties tended to have high hypertension-related death rates. The lowest hypertension death rates (i.e., bottom quintile 0.0% – 6.4%) were mostly found in counties of the southern regions.
ArcGIS
Hypertension death rates: Florida Department of Health, Bureau of Vital Statistics. Accessed July 24, 2019, from Florida Department of Health, Division of Public Health Statistics & Performance Management (2019). Hypertension deaths. Available at: http://www.flhealthcharts.com/Charts/DataViewer/DeathViewer/DeathViewer.aspx?indNumber=0099.
Hypertension control among FQHCs: Health Resources and Services Administration (HRSA) [2019]. Accessed July 24, 2019, from HRSA Health Center Program. 2017 HRSA-funded Health Center Awardees Data. Available at: https://bphc.hrsa.gov/uds/datacenter.aspx?q=d&year=2018&state=FL#glist
Data for hypertension death rates was gathered from the Florida Department of Health (FDOH), Division of Public Health Statistics & Performance Management website (ICD-10 Codes: I10, I12, I15).
Hypertension control and FQHCs' location data were collected from the Health Resources and Services Administration (HRSA) website. Hypertension control was gathered in the pool of clinical data.
Shapefile was obtained from files provided by the Rice University GIS training team, available at: https://app.box.com/folder/73935956763. Accessed June 2019.
Graduated Color Scheme was used to display hypertension death rate by quintile.
The United States Census geocoder was used to geocode the main addresses of the FQHCs and Point Markers were used to display the location of the FQHCs across counties.
Graduated Symbols with 50% transparency were used to show the average percent of blood pressure control achieved by FQHCs in a county. Hypertension control was defined as blood pressure < 140/90 among hypertensive patients.
Rodrigue Pierre, Florida Department of Health
Rodrigue Pierre, Florida Department of Health. Accessed from the Centers for Disease Control and Prevention's Chronic Disease Map Gallery.

