Key points
Data sources
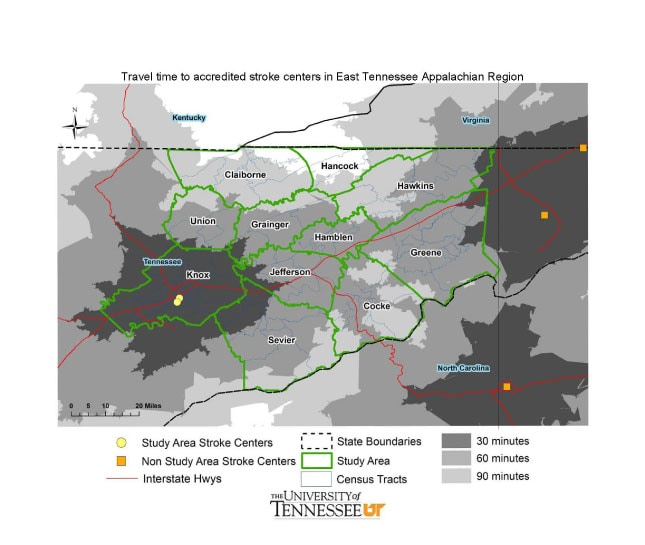
The darkest-shaded areas are neighborhoods that had access to stroke centers within 30 minutes. The lighter- shaded areas had access within 60 minutes, while the very light-shaded areas had access within 90 minutes. Most of the areas that had long travels time to stroke centers were neighborhoods in the rural areas.
The map was generated to investigate and identify neighborhood disparities in travel time (geographic accessibility) to emergency stroke care. It shows that important disparities in geographic accessibility to stroke care exist in East Tennessee Appalachian Region. This may have significant implications for health outcomes related to stroke.
Reprinted from Annals of Epidemiology Vol 20 Issue 12, Investigation of Disparities in Geographic Accessibility to Emergency Stroke and Myocardial Infarction in East Tennessee Using Geographical Information Systems and Network Analysis, 924-930 (2010), with permission from Elsevier.
ArcGIS 9.3 ESRI, Network Analyst Extension of ArcGIS ESRI
StreetMap USA
Network analysis.
Dr. Agricola Odoi, Assistant Professor, The University of Tennessee, Knoxville
(865) 974-5568
aodoi@utk.edu
Travel time to accredited stroke centers in East Tennessee Appalachian Region. Reprinted from Annals of Epidemiology Vol 20 Issue 12, Investigation of Disparities in Geographic Accessibility to Emergency Stroke and Myocardial Infarction in East Tennessee Using Geographical Information Systems and Network Analysis, 924-930 (2010), with permission from Elsevier Ashley S. Pedigo, University of Tennessee; Agricola Odoi, University of Tennessee. Accessed from the Centers for Disease Control and Prevention's Chronic Disease Map Gallery.

