Exploring the Spatial Variation in Bus Arrivals in Modesto, California and the Relationship to Select Socio-demographic Variables

Chronic Disease Map Gallery

Key points

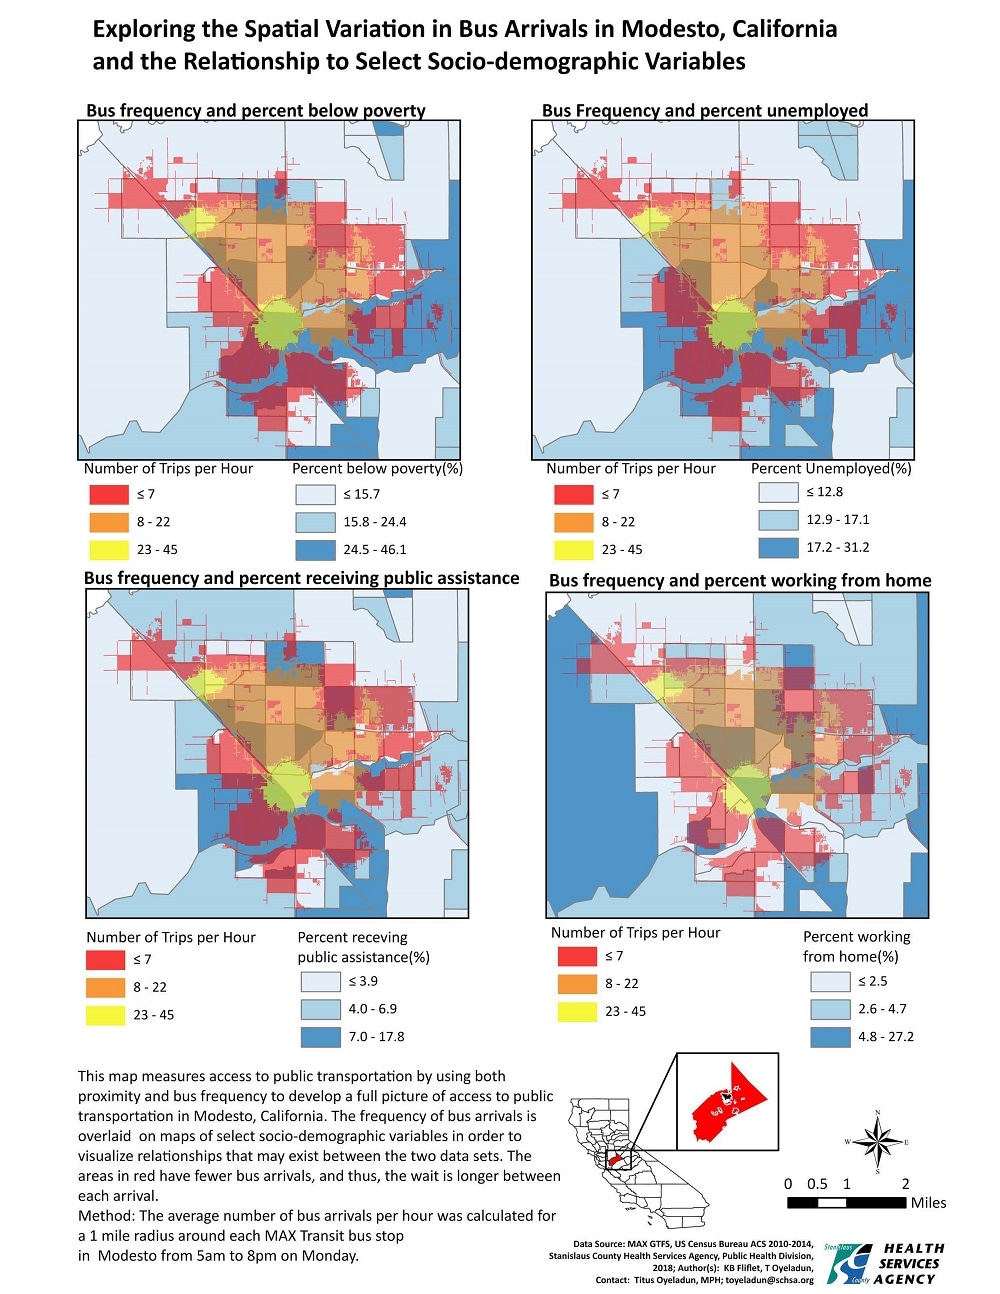
Residents in low-income neighborhoods in Modesto California experience longer wait times between bus arrivals. This may be a contributing factor to missed medical appointment; even though they may live closer to a doctor’s office or hospital.

Map

This map measures access to public transportation by using both proximity and bus frequency to develop a full picture of access to public transportation in Modesto, California. The frequency of bus arrivals is overlaid on maps of select socio-demographic variables in order to visualize relationships.
Exploring the spatial variation in bus arrivals in relation to select socio-demographic variables in Modesto, California

Data sources

ESRI ArcGIS Pro

MAX GTFS; US Census Bureau ACS 2010-2014

The average number of bus arrivals per hour was calculated for a 1 mile radius around each MAX.

Titus Oyeladun, Epidemiologist, Stanislaus County Health Service Agency
209-558-7539
toyeladun@schsa.org

Oyeladun, Titus, Stanislaus County Health Service Agency; Fliflet, Kyle, Stanislaus County Health. Accessed from the Centers for Disease Control and Prevention's Chronic Disease Map Gallery.