Key points
Map

Data sources
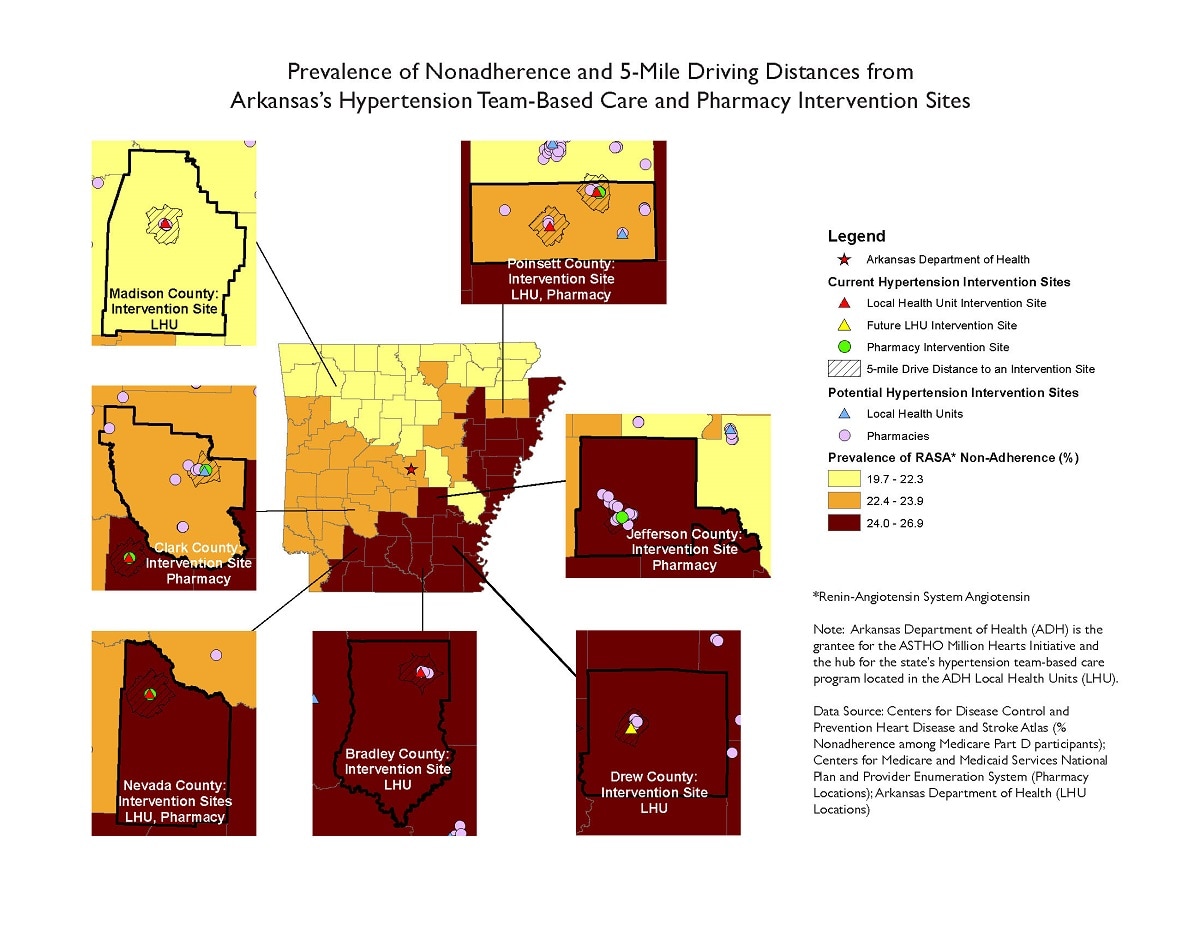
Four of the five LHU intervention sites, shown as red triangles, and all the pharmacy intervention sites, shown as green circles, were located in counties with medication nonadherence ≥22.4%.
This map and the techniques applied here will help the Arkansas Department of Health scale up its hypertension and diabetes prevention and control efforts in Arkansas to reduce mortality, emergency room visits, and hospitalization rates due to these conditions.
ArcGIS
Data Source: Centers for Disease Control and Prevention Heart Disease and Stroke Atlas (% Nonadherence among Medicare Part D participants); Centers for Medicare and Medicaid Services National Plan and Provider Enumeration System (Pharmacy Locations); Arkansas Department of Health (LHU Locations)
County-level of nonadherence prevalence data for the antihypertensive renin-angiotensin system antagonist group of drugs among Medicare Part D beneficiaries were mapped. Three strata were used to define medication nonadherence. LHU intervention sites and pharmacy intervention sites were plotted with 5-mile driving distances to show population access to these sites.
Brandy Sutphin, Analytical Epidemiology, Arkansas Department of Health
501-661-2889
brandy.sutphin@arkansas.gov
Brandy Sutphin, Arkansas Department of Health. Accessed from the Centers for Disease Control and Prevention's Chronic Disease Map Gallery.
