Key points
Map details
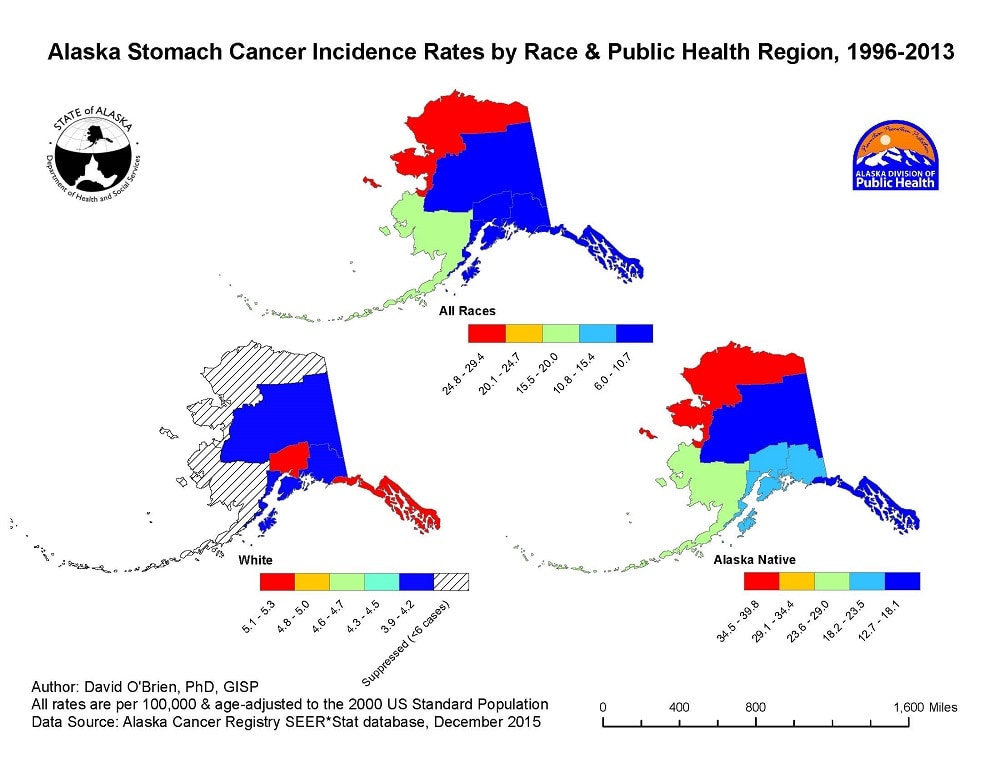
The rate disparity by geography can be attributed to the statewide population distribution of races. The regions with the highest stomach cancer rates are also those with the highest proportions (about 70%) of Alaska Native residents.
The rates for Whites are relatively low, ranging from 3.9-5.3 per 100,000. Rates for Alaska Natives in all public health regions are significantly higher than for Whites. However, there is a large difference in rates for Alaska Natives by geography. Rates are lowest in Southeast (12.7) and Interior (15.2), and highest in the Southwest (25.8) and Northern (39.8) regions.
This rate difference by geography for Alaska Natives may be due to several factors. H. pylori, a bacterium causing chronic gastritis, is an important cause of stomach cancer globally and an infection prevalence of 75% has been reported in the Alaska Native population. The distribution of H. pylori infection by geography across Alaska is not well understood. Diet is also thought to be an important risk factor for stomach cancer and many Alaska Natives preserve their food by salting and smoking. Tobacco use is also high among the Alaska Native population and a risk factor for stomach cancer. It is not known to what extent the variation in diagnosis rates reflects these or other risk factors for stomach cancer.
ArcMap v.10.3.1; SEER*Stat v.8.2.1
Alaska cancer incidence data from the Alaska Cancer Registry database.
All rates are age-adjusted to the 2000 U.S. standard population and per 100,000 population. Data are suppressed if the number of cancer cases is less than 6. An equal interval classification scheme was used to symbolize the data.
David O'Brien, PhD, GISP, Data Analyst, Alaska Cancer Registry, Alaska Department of Health & Social Services
907-269-8047
david.obrien@alaska.gov
O'Brien, D. "Alaska Stomach Cancer Incidence Rates by Race and Public Health Region" [map]. December 2015. Alaska Department of Health and Social Services. Accessed from the Centers for Disease Control and Prevention's Chronic Disease Map Gallery.

