At a glance
- Data indicate that Americans eat and drink too many added sugars. How much people consume varies by age, race, and ethnicity.
- Consuming too many added sugars can contribute to health problems such as weight gain and obesity, type 2 diabetes, and heart disease.
- The Dietary Guidelines for Americans 2020–2025 has recommendations for added sugar intake across the lifespan.

About added sugars
To live healthier, longer lives, most Americans need to move more and eat better. This includes consuming fewer added sugars. Consuming too many added sugars can contribute to health problems such as weight gain and obesity, type 2 diabetes, and heart disease.
Added sugars are sugars added during the processing of foods. Added sugars include foods packaged as sweeteners, sugars from syrups and honey, and sugars from concentrated fruit or vegetable juices. Added sugars do not include naturally occurring sugars in milk, fruits, and vegetables.
The leading sources of added sugars in the US diet are sugar-sweetened beverages, desserts, and sweet snacks. Examples of desserts and sweet snacks are cookies, brownies, cakes, pies, ice cream, frozen dairy desserts, doughnuts, sweet rolls, and pastries.
Recommendations
The Dietary Guidelines for Americans 2020–2025 recommends that:
- People age 2 years or older limit added sugars intake to less than 10% of their total daily calories. That means:
- For a 2,000 calorie diet, no more than 200 calories should come from added sugars.
- 200 calories equal about 12 teaspoons of added sugar from both food and beverages.
- For a 2,000 calorie diet, no more than 200 calories should come from added sugars.
- Children younger than 2 years should not be given any foods or beverages with added sugars.
A leading objective for Healthy People 2030 is to reduce the consumption of added sugars by people aged 2 years or older.
Consumption of sugar-sweetened beverages among children
Too many children in the U.S. are drinking sugar-sweetened drinks at a young age.
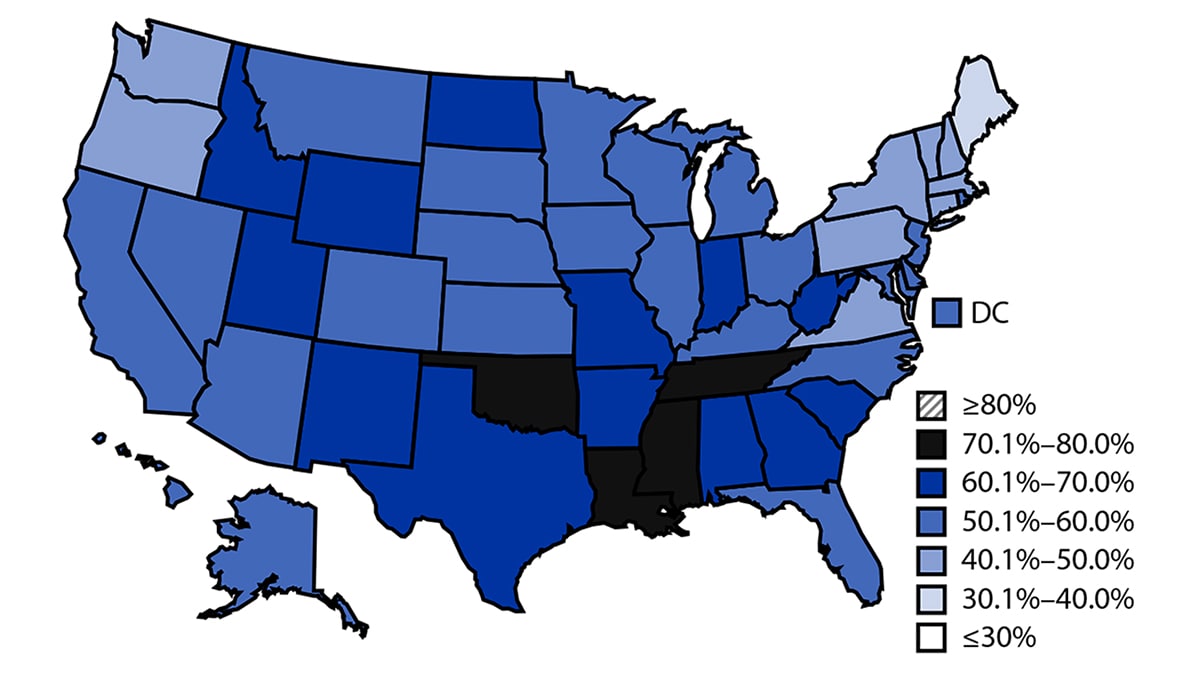
In 2021, data from the National Survey of Children’s Health found 57.1% of children aged 1 to 5 years had consumed at least one sugar-sweetened beverages in the past 7 days.1
The map below shows the percentage of children aged 1–5 years who drank at least one sugar-sweetened beverage in the preceding week.

For tips on choosing healthier drink options, go to Rethink Your Drink.
Consumption in children and young adults
In 2017–2018, the average daily intake of added sugars was 17 teaspoons for children and young adults aged 2 to 19 years.[1]
The average daily intake of added sugars was 18 teaspoons for boys and 15 teaspoons for girls.
Among children aged 2 to 5 years, the average daily intake of added sugars was:
- 13 teaspoons for non-Hispanic Black children.
- 12 teaspoons for non-Hispanic White children.
- 11 teaspoons for Hispanic children.
- 7 teaspoons for non-Hispanic Asian children.
Among children aged 6 to 11 years, the average daily intake was:
- 19 teaspoons for non-Hispanic Black children.
- 18 teaspoons for non-Hispanic White children.
- 16 teaspoons for Hispanic children.
- 12 teaspoons for non-Hispanic Asian children.
Among young people aged 12 to 19 years, the average daily intake was:
- 20 teaspoons for non-Hispanic Black young people.
- 20 teaspoons for non-Hispanic White young people.
- 15 teaspoons for Hispanic young people.
- 14 teaspoons for non-Hispanic Asian young people.
Consumption in adults
In 2017–2018, the average daily intake of added sugars was 17 teaspoons for adults aged 20 or older.[1]
The average daily intake of added sugars was 19 teaspoons for men and 15 teaspoons for women.
The average daily intake of added sugars was:
- 19 teaspoons for non-Hispanic Black adults.
- 17 teaspoons for non-Hispanic White adults.
- 16 teaspoons for Hispanic adults.
- 10 teaspoons for non-Hispanic Asian adults.
- Hamner HC, Dooyema CA, Blanck HM, et al. Fruit, Vegetable, and Sugar-Sweetened Beverage Intake Among Young Children, by State — United States, 2021. MMWR Morb Mortal Wkly Rep 2023;72:165–170. DOI: http://dx.doi.org/10.15585/mmwr.mm7207a1
- US Department of Agriculture, Agricultural Research Service. Food Patterns Equivalents Intakes from Food: Mean Amounts Consumed per Individual, What We Eat in America, NHANES 2017–2018. Accessed February 14, 2024. https://www.ars.usda.gov/ARSUserFiles/80400530/pdf/FPED/tables_1-4_FPED_1718.pdf
